|

2018 Workplace Deaths Reach Highest Point Since 2007,
According to BLS Census Data
Government
Data Validates The D&D Daily's 2018 Retail Fatality Report
On-the-job deaths in the United States in 2018 reached their highest level since
2007, according to
Census of
Fatal Occupational Injuries data released in December 2019 by the US
Bureau of Labor Statistics (BLS).
The report found that in 2018, a total of 5,250 workers died in the United
States as a result of on-the-job injuries-a 2 percent increase from 2017.
The overall rate of fatal workplace injuries remained unchanged between 2017 and
2018-3.5 per 100,000 full-time equivalent workers.
The 2018 Census of Fatal Occupational Injuries studies the 5,250 deaths into 10
categories/100+ sub-categories, of those 5250 a total of 828 or 16% were
considered violent in nature. The report covers everything from Construction,
Manufacturing, Retail and others.
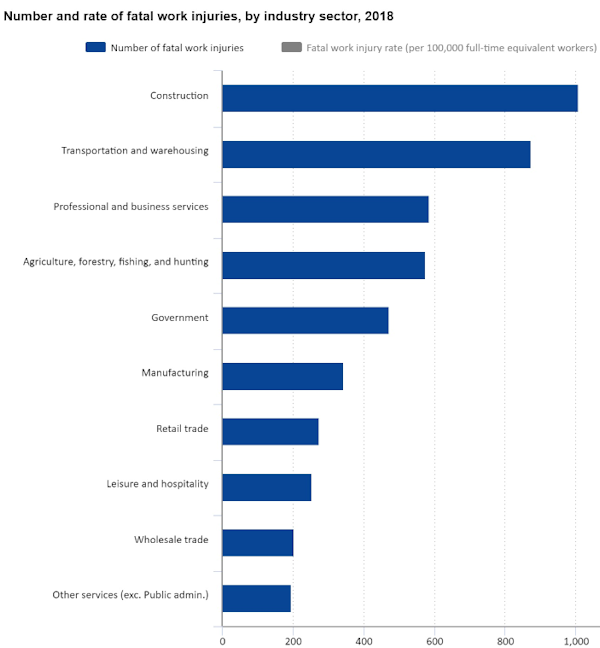
As the graph below shows, construction jobs did lead the Census with 1,008
deaths, while Transportation and Warehousing accounted for 874. Retail
Related deaths accounted for 274 employees. Of those 274 Retail employee
deaths, 130 are ruled Violent in nature. It should also be noted that Restaurant
Industry deaths are not considered part of the Retail Trade in the government
report.
The category of Food Services and Drinking Place accounted for 129 Deaths
overall, 71 of those Violent. Restaurants accounted for 46 of those 71
employee deaths (23 Limited Service Restaurants / 19 Full Service Restaurants),
while 24 employees were killed inside Bars.
Security and Armored Car Services also accounted for 23 deaths in 2018.
The Government Data Tracks Closely with the D&D Daily's Crime Reporting
Everyday, here at The D&D Daily, we look into the
crimes and accidents that cost lives in the world of Retail. In our 2018
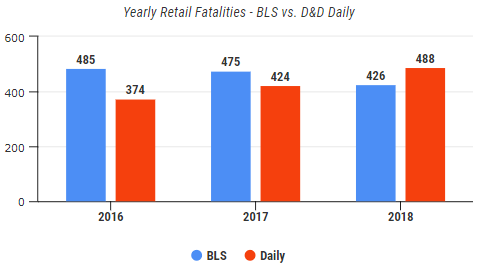
'Retail Violent Death Report', we reported 488 deaths and 429 Criminal Acts.
These numbers track closely with the census report, which - across the three
categories of Retail, Food Services and Drinking Place, and Security and Armored
Car Services - reported 426 total fatalities in 2018.
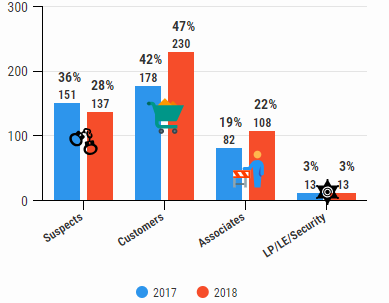 The
graph to the right breaks down the 488 deaths reported in the Daily in 2018. Of
the fatalities, 72% were victims (customers, associates, LP/security) and 28%
were suspects. The
graph to the right breaks down the 488 deaths reported in the Daily in 2018. Of
the fatalities, 72% were victims (customers, associates, LP/security) and 28%
were suspects.
Another category that shows similarities between government data and D&D
Daily reporting is the location of these incidents.
According to the census data, Restaurants make up 23% of fatal occupational
injuries, while Gas Stations (18%), Bars (12%), C-Stores (10%),
Grocery (3%) and Auto Parts (3%) follow behind.
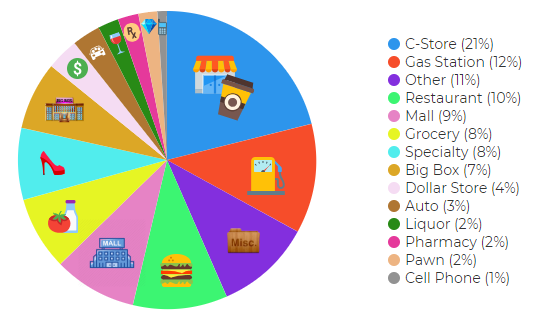
As the graph below shows, the Daily reported similar findings in 2018, with
C-Stores making up 21% of fatalities, Gas Stations making up 12%,
Restaurants 10% & Grocery 8%.
While there are some differences in how each
report categorizes these fatal incidents, there is no question that the raw data
we're seeing from our research is reflected in what the government is reporting.
In Case You Missed It - The D&D Daily's Latest Crime Reports
Click here to see more exclusive reports.
 Share on Facebook
 Share on Twitter
 Share on LinkedIn
|
Click here to read all
of the Daily's exclusive retail crime reports
|
Protos
Security
Sponsor of the D&D Daily's Retail
Crime Column
Thanks Protos Security for making this column and
report possible.
Hey LP and AP Execs - Thank Protos!
&uuid=(email))
|
