|

The D&D Daily's
Exclusive - Publicly Reported
Q4 & 2019
'Retail Violent Fatalities Report'
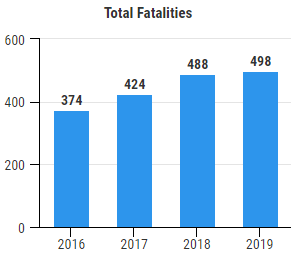
498
Fatalities – Up 33% Over 2016
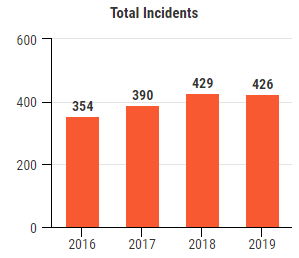
426 Incidents – Up 20% Over 2016
Fatalities: 72% Victims – 28% Suspects
Yearly Comparison
2016 -
2017 - 2018 - 2019
|
Up 33%
 |
Up 20%
 |
|
•
Fatalities Up 33% since 2016
•
Incidents up 20% since 2016
•
Flat Over 2018
|
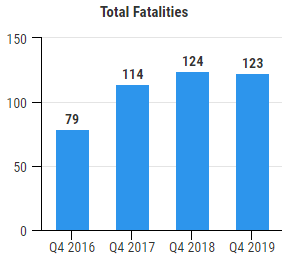
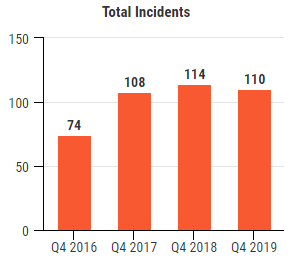
4th Quarter Comparison
2016 -
2017 - 2018 - 2019
|
Up 55%
|
Up 48%
|
|
•
123 Fatalities – Up 55% Over 2016
•
110 Incidents – Up 48% Over 2016
•
Flat Over 2018 |
|
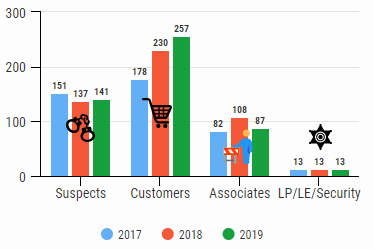
2019's
498
Retail Violent Fatalities by Category
72% Victims - 28% Suspects
257/51.6% Customers,
87/17.4% Associates, 13/2.6% LP/LE/Security
141/28% Suspects
3 Yr. Average
70% Victims - 30% Suspects
47% Customers, 19% Associates, 3% LP/LE/Security
30% Suspects
|
498 Total 2019 Violent
Fatalities
• 28%,
141 Suspects - Up 3% from '18
• 52%,
257 Customers - Up 12% from '18
•
17%, 87 Associates - Down 19% from '18
•
3%, 13 LE/LP/Security - Same as '18
488 Total 2018 Violent Deaths
•
28%, 137 Suspects - Down 9% from '17
• 47%,
230 Customers - Up 29% from '17
•
22%, 108 Associates - Up 32% from '17
•
3%, 13 LE/LP/Security - Same as '17
424
Total 2017 Violent Deaths
• 36%,
151 Suspects
• 42%,
178 Customers
•
19%, 82 Associates
•
3%, 13 LE/LP/Security
|
|
|
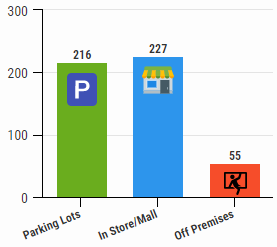
2019 Fatalities
Location
46% In-Store, 43% Parking Lots, 11% Off Premises
3 Yr. Average
48% in Parking
Lots, 39% In-Store or Mall, 12% Off Premise
|
|
2019
Totals
•
43%,
216 killed in parking lots
•
46%,
227 inside store or mall
•
11%,
55 died off premises
2018
Totals
•
51%,
250 killed in parking lots
•
35%,
172 inside store or mall
•
14%,
66 died off premises
2017 Totals
•
50%,
214 killed in parking lots
•
37%,
156 inside store or mall
•
13%,
54 died off premises
|
|
|
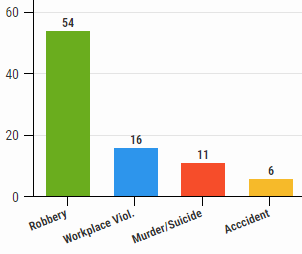
2019: 87 Associate Fatalities
62% Commission of Crime, 18% Workplace Violence
12% Murder/Suicide, 7% Accidental
3 Yr. Average
62% Commission of Crime, 18% Workplace Violence
12% Murder/Suicide, 7% Accidental
|
|
2019 Totals
•
54 killed during robberies,
burglaries or thefts
•
16 killed in
argument/co-worker/workplace violence
•
11 killed in
murder/homicide/suicide
•
6 killed in accident
2018 Totals
•
55 killed during robberies,
burglaries or thefts
•
19 killed in
argument/fight
•
20 killed in
murder/homicide/suicide
•
14 killed
by
former co-worker/relative/other
2017 Totals
• 58
killed during robberies, burglaries or thefts
•
10 killed in
argument/fight
•
8 killed by former
c-worker
•
5 killed by
relative/customer
•
1 killed in
murder/homicide
|
|
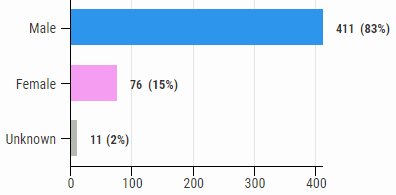
2019 Total Fatalities by Gender
83% Male – 15% Female
|
2019 Totals
•
83%,
411 Males
•
15%,
76 Females
•
2%, 11 n/a
2018 Totals
•
77%,
377 Males
•
16%,
77 Females
•
7%,
34 n/a
2017 Totals
•
77%,
371 Males
•
16%,
42 Females
•
7%,
11 n/a
|
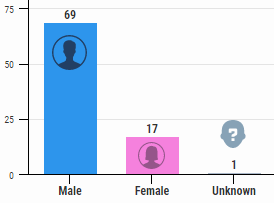
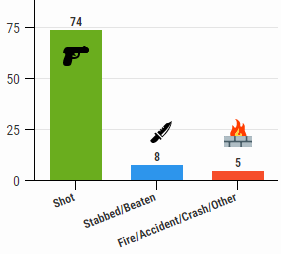
2019: 87 Associate Fatalities By Gender & Method
|
 |
|
2019 Totals
•
79%,
69 Males
•
20%,
17 Females
•
1%,
1 n/a
2018 Totals
•
69%,
74 Males
•
23%,
25 Females
•
8%,
9 n/a
2017 Totals
•
78%,
64 Males
•
18%,
15 Females
•
4%,
3 n/a
|
2019 Totals
•
85%, 74
shot
•
10%, 8
stabbed
•
5%, 5 fire/accident/crash/other
2018 Totals
•
83%,
90 Killed by gun
•
12%, 13
stabbed/beaten
•
3%,
3
run over
•
2%,
2
medical reasons/other
2017 Totals
•
83%,
72 Killed by gun
•
12%, 7
stabbed/beaten
•
3%,
3
other
|
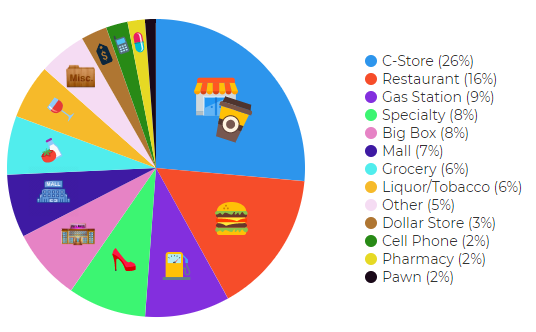
2019
Fatalities by Store Type
C-Stores Top Store Type Four Straight Years
|
2016:
1.
C-stores (26%)
2. Gas Stations (25%)
3. Big Box (21%)
4. Restaurants (9%)
5. Dollar Stores (8%)
|
2017:
1.
C-stores (18%)
2. Big Box (17%)
3. Gas Stations (12%)
4. Restaurants (9%)
5. Other (7%)
|
2018:
1.
C-stores (21%)
2. Gas Stations (12%)
3. Other (11%)
4. Restaurant (10%)
5. Mall (9%) |
2019:
1.
C-stores (26%)
2. Restaurants (16%)
3. Gas Station (9%)
4. Specialty (8%)
5. Big Box (8%) |
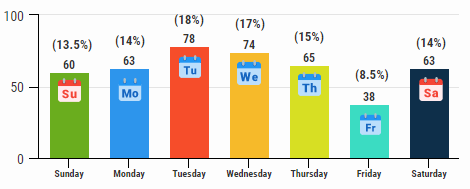
2019 Fatality Incidents by Weekday
Tuesday & Wednesday Highest - Friday Consistently Lowest
3 Yr. Average
Saturday - 71;
Monday & Wednesday - 70; Tuesday - 68; Sunday - 67
Thursday - 57; Friday - 39
*2016
Top Days:
1. Sunday
2. Friday
3. Saturday
4. Wednesday
5. Monday
6. Tuesday
7. Thursday
|
2017
Top Days:
1. Monday - 71
2. Sunday - 63
3. Saturday - 62
4. Wednesday - 58
5. Tuesday - 56
6. Thursday - 49
7. Friday - 42
|
2018
Top Days:
1. Saturday - 89
2. Wednesday - 79
3. Sunday - 77
4. Monday - 77
5. Tuesday - 70
6. Thursday - 57
7. Friday - 38
|
2019 Top
Days:
1. Tuesday - 78
2. Wednesday - 74
3. Thursday - 65
4. Monday - 63
5. Saturday - 63
6. Sunday - 60
7. Friday - 38
|
*Complete data not available
for 2016
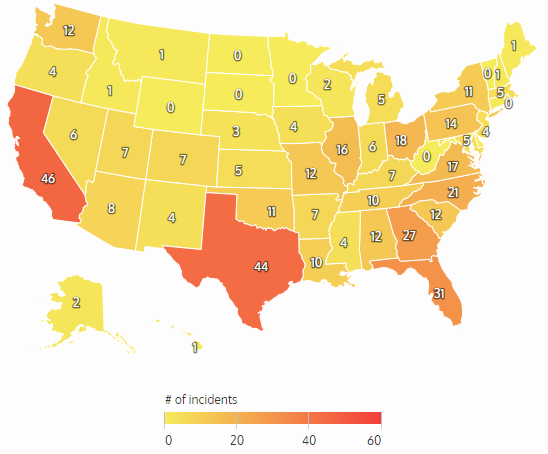
2019 Fatality Incidents by State
California Surpasses Texas as Top State
4 Yr. Average
Texas - 48; California - 45; Florida - 30; Georgia - 25
2016:
1.
Texas (43)
2. California (39)
3. Florida (31)
4. Georgia (23)
5. Ohio (7) |
2017:
1. Texas (52)
2. California (49)
3. Georgia (27)
4. Florida (25)
5. Tennessee (17) |
2018:
1. Texas (54)
2. California (45)
3. Florida (33)
4. Georgia (24)
5. New York (18) |
2019:
1. California (46)
2. Texas (44)
3. Florida (31)
4. Georgia (27)
5. North Carolina (21) |
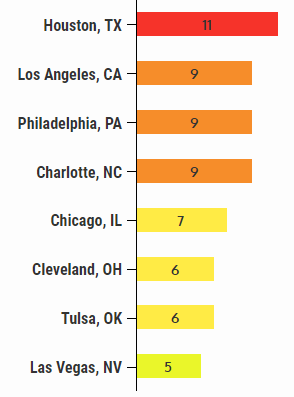
2019 Fatality Incidents by City
Houston
Most Deaths 4 Straight Years
Los Angeles, Philadelphia & Charlotte Become Hot Zones
| |
2019 Top Cities
1. Houston, TX
2. Los Angeles, CA
2. Philadelphia, PA
2. Charlotte, NC
3. Chicago, IL
4. Cleveland, OH
4. Tulsa, OK
5. Las Vegas, NV
2018 Top Cities
1. Houston, TX
2. Las Vegas, NV
2. Birmingham, AL
3. Nashville, TN
3. New Orleans, LA
3. Jacksonville, FL
2017 Top Cities
1. Houston, TX
2. Memphis, TN
3. Atlanta, GA
4. Las Vegas, NV
5. Colorado Springs, CO
2016:
1. Houston, TX
2. Atlanta, GA
3. Detroit, MI
4. Phoenix, AZ
5. Chicago, IL |
 |
Methodology: The Daily collects this retail store specific information
from public news media sources throughout the United States and reports it daily
in our Retail Crime column. We do not survey any retailers or third parties nor
collect information from any retail executive. All of this information is
available through public news media outlets. We do not claim nor does it
represent all such incidents or deaths that may occur in retail locations or
retail corporate facilities as many may not be reported in the news media
depending on a number of variables outside of our control. We are not
responsible for the accuracy of the information reported in the various news
media outlets. We do not name any retailer, retail executive, suspect, or
victim.
Copyright: We reserve the rights to this industry exclusive
report and do not authorize its republication or reproduction without written
consent which may include a fee. By re-publishing or reproducing this report or
any parts of it without authorization the party agrees to pay a fee determined
by the D&D Daily.
 Share on Facebook
 Share on Twitter
 Share on LinkedIn
|
Click here to read all
of the Daily's exclusive retail crime reports
|
Protos
Security
Sponsor of the D&D Daily's Retail
Crime Column
Thanks Protos Security for making this column and
report possible.
Hey LP and AP Execs - Thank Protos!
&uuid=(email))
|
