Click here to view the web version of this report


The D&D Daily's
Exclusive - Publicly Reported
Q4 & 2019 ORC Report
ORC Cases Up 33% Over 5 Years - Flat Since 2018
Average Dollar Amount Doubled Since '16 - Up 37% Since '18
Most Suspects Ever Recorded - Male or Female
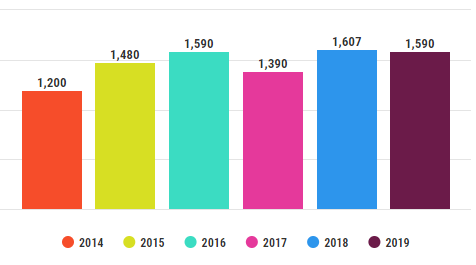
Yearly ORC Case Comparison - Down 1% Over '18
Q4 ORC Case Comparison - Down 17% Over '18
 Latest
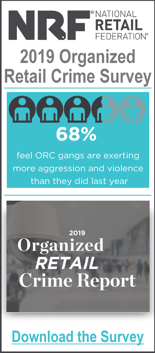
NRF ORC Study Highlights Similar Trends
Latest
NRF ORC Study Highlights Similar Trends
Two-Thirds of Retailers See Increase in Organized Thefts
"Organized
retail crime continues to present a serious challenge to the retail
industry," NRF Vice President of Loss Prevention Bob Moraca said.
The report found that
97 percent of retailers had been victimized by ORC in the past year and
that 68 percent had seen an increase in ORC activity.
Losses averaged $703,320 per $1 billion in sales, marking the fourth
year in a row that the figure topped the $700,000 mark.
Nearly two-thirds (65 percent) of retailers said ORC is a higher
priority for their companies than five years ago,
while 56 percent were allocating additional technology resources to the
issue and 44 percent were increasing their loss prevention budgets.
The top five cities for ORC in the past year in order were Los Angeles,
New York, Houston, Chicago and Miami,
with a number of ties rounding out the top 10.
nrf.com
| Year | # of Cases | $ Amount Reported | $ Average Per Case |
| 2014 | 1,200 | $681,802,614 | $194,002 |
| 2015 | 1,480 | $515,088,741 | $112,222 |
| 2016 | 1,590 | $514,285,830 | $71,877 |
| 2017 | 1,390 | $389,445,396 | $97,658 |
| 2018 | 1,607 | $165,493,452 | $102,982 |
| 2019 | 1,590 | $248,763,877 | $141,360 |
• Average
case value nearly doubled since 2016, 37% increase since 2018
•
Average case values: Ranged from a low of $71,877 to a high of $194,002.
•
2016 to present represents post-EMV
Special note: 2014 and 2015 amounts reflect the pre-EMV roll-out and a
larger amount of big counterfeit credit card cases.
The following high-dollar counterfeit credit card cases were excluded in the
average calculations:
•
Two $200M cc fraud cases on
May 14 &
June 20, 2014
•
One $325M counterfeit case on
Jan. 16, 2015
•
Two $200M cc fraud cases on
Jan. 8 &
May 9, 2016
•
One $170M cc fraud case on
April 19, 2017
•
One $51M cc fraud case on
May 23, 2018
• One $30M cc fraud case
on
Sept. 26, 2014
• One $24M cc/gift card fraud case
on
July 11, 2019
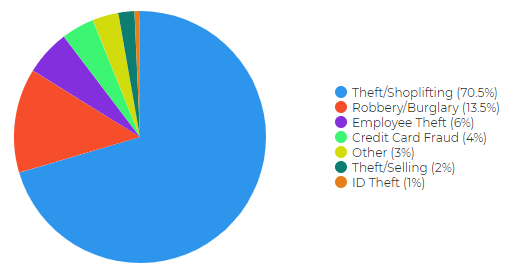
ORC Cases By Type
 |
|
2019 Cases: 1. Theft/Shoplift - 70.5% 2. Robbery/Burg. - 13.5% 3. Emp. Theft - 6% |
2018
Cases: 1. Theft/Shoplift - 66% 2. Robbery/Burg. - 12% 3. Emp. Theft - 8% |
2017
Cases: 1. Theft/Shoplift - 67% 2. Robbery/Burg. - 11% 3. Emp. Theft - 6% |
2016
Cases: 1. Theft/Shoplift - 67% 2. Other - 11% 3. CC Fraud - 8% |
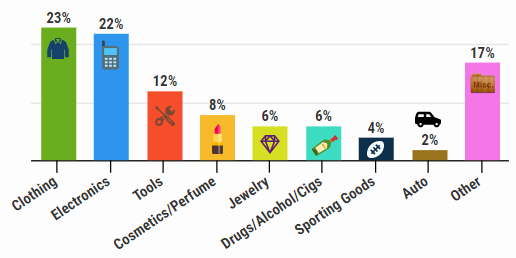
ORC Cases by Merchandise Stolen
|
2019 • Clothing (23%) • Electronics (22%) • Tools (12%) |
2018 1. Clothing (30%) 2. Electronics (27%) 3. Tools (14%) |
2017* 1. Electronics (30%) 2. Clothing (16%) 3. Jewelry (15%) |
*The Daily started tracking merchandise in May 2017 **Other includes eyewear, baby formula/diapers, detergent, groceries, gift cards, lottery, gas, hobby, coins, cash, razors & n/a |
||
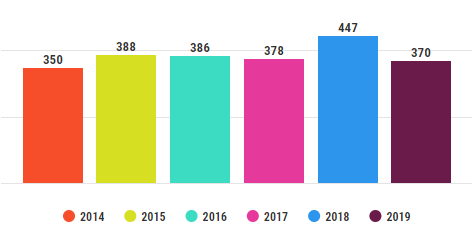
ORC Suspect Comparison
| Year | Suspects | Male | Female | Unreported | % Male | % Female |
| 2014 | 3,235 | 1,764 | 1,048 | 423 | 63% | 37% |
| 2015 | 3,528 | 1,843 | 1,097 | 588 | 63% | 37% |
| 2016 | 3,682 | 1,687 | 1,006 | 989 | 63% | 37% |
| 2017 | 3,225 | 1,319 | 901 | 1,005 | 59% | 41% |
| 2018 | 3,420 | 1,701 | 1,142 | 577 | 60% | 40% |
| 2019 | 3,710 | 2,018 | 1,188 | 504 | 63% | 37% |
Most suspects - male or female - ever recorded in publicly reported data.
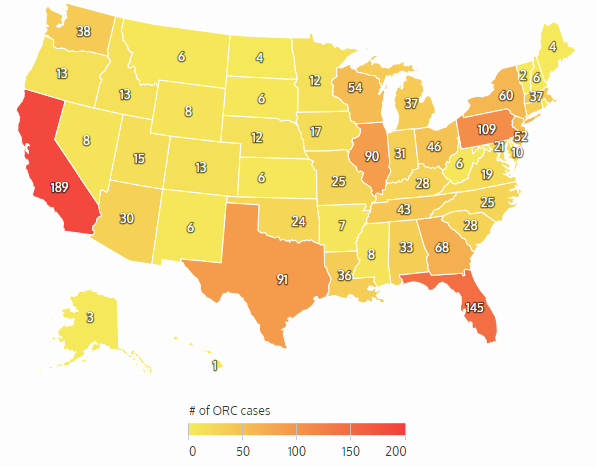
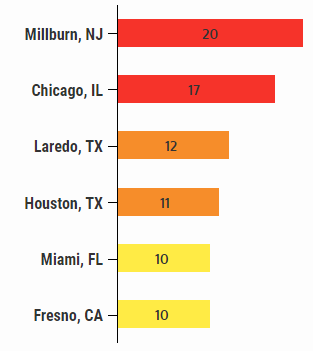
ORC Cases by State & City
|
Top States - 2019 |
Top States - 2018 |
Top States - 2017 |
Top States - 2016 |
|
Top Cities - 2019 • Millburn, NJ (20) • Chicago, IL (17) • Laredo, TX (12) • Houston, TX (11) • Miami, FL & Fresno, CA (10) Top Cities - 2018 1. Memphis, TN & Tallahassee, FL (14) 2. Detroit, MI & Oklahoma City, OK (13) 3. Houston, TX (12) 4. Chicago, IL (10) 5. Lexington, KY & Albuquerque, NM (9) Top Cities - 2017* 1. Houston, TX & Milburn, NJ (9) 2. Memphis, TN & Columbus, OH (8) 3. Louisville, KY & Lexington, KY (7) 4. Polk County, FL (6) 5. Oklahoma City, OK (6) |
|
*The Daily started tracking city data in May 2017 |
|

Auror
Sponsor of the D&D
Daily’s ORC News Column
Thanks, Auror, for making this
column and this report possible.
Hey LP and AP Execs - Thank Auror!
![]() Share on Facebook
Share on Facebook
![]() Share on Twitter
Share on Twitter
![]() Share on LinkedIn
Share on LinkedIn
|
|
Methodology: The Daily
collects this retail store specific information from public news media
sources throughout the United States and reports it daily in our Organized
Retail Crime column. We do not survey any retailers or third parties nor collect
information from any retail executive. All of this information is available
through public news media outlets. We do not claim nor does it represent all
such incidents or deaths that may occur in retail locations or retail
corporate facilities as many may not be reported in the news media depending
on a number of variables outside of our control. We are not responsible for
the acccuracy of the information reported in the various news media outlets.
We do not name any retailer, retail executive, suspect, or victim.
Copyright: We reserve the rights to this industry exclusive
report and do not authorize its republication or reproduction without
written consent which may include a fee. By re-publishing or reproducing
this report or any parts of it without authorization the party agrees to pay
a fee determined by the D&D Daily.
