&uuid=(email))

The D&D Daily's
Publicly Reported
Q4 & Full Year 2019
Robbery Report
Robberies Down 6.6% From 2016
Q4 Robberies Down 22% From 2016
C-Stores Top Retail Sector - Houston Top City - Monday Top Day

Yearly & Quarterly Comparison
2016-2019
Robberies Down 6.6% From 2016 - 3% from 2018
Q4 Robberies Down 22% From 2016 - 11% from Q4 2018
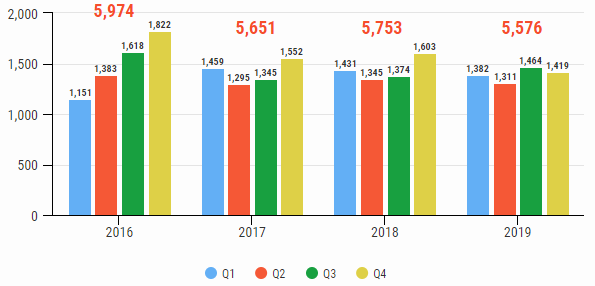
Full Year
- 2016-2019
• 2019 - 5,576 (down 3% from '18)
• 2018 - 5,753 robberies (up
1.8% from '17)
• 2017 - 5,651 robberies (down
5% from '16)
• 2016 – 5,974 robberies (Started Tracking)
Q4 Comparison
- 2016-2019
•
Q4 2019 - 1,419 robberies (down 11% from '18)
•
Q4 2018 - 1,603 robberies (up 3.3% from '17)
•
Q4 2017 - 1,552 robberies (down
14.8% from '16)
• Q4 2016 – 1,822 (Tracking Began)
FBI 2018 Crime Index – Robberies Overview
Robberies Down 12.6% From
2014
There were an estimated 282,061 robberies nationwide in 2018. The
estimated number of robberies decreased 12.0 percent from the 2017
estimate and decreased 12.6 percent from the 2014 estimate. The 2018
estimate was down 31.0 percent from the 2009 estimate.
(See Tables
1 and
1AFBI — Table 1.)
|
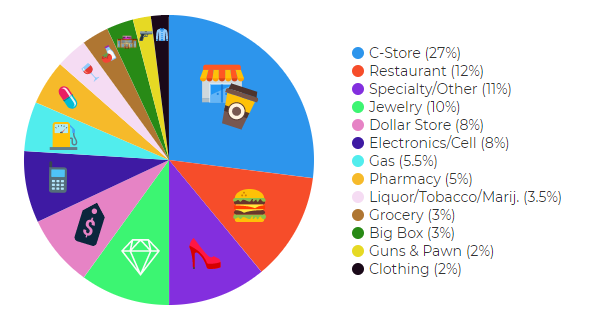
*2016 Totals: 1. C-Stores/Gas 2. Pharmacy 3. Dollar Stores 4. Restaurants 5. Cell/Elect. |
2017 Totals: 1. C-Store (48%) 2. Dollar Stores (17%) 3. Pharmacy (17%) 4. Cell/Elect. (8%) 5. Restaurants (6%) |
2018 Totals: 1. C-Store (31%) 2. Restaurant (10%) 3. Dollar Store (8%) 4. Cell/Elect. (8%) 5. Pharmacy (8%) |
2019
Totals: 1. C-Store (27%) 2. Restaurant (12%) 3. Specialty/Other (11%) 4. Jewelry (10%) 5. Dollar Store/Elect. (8%) |
*2016 data did not include percentages
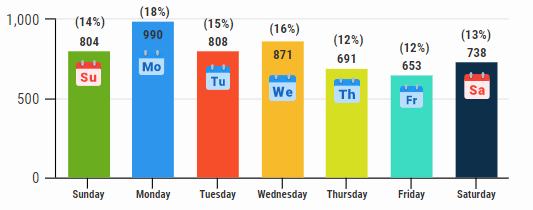
2019 Robberies by Weekday Monday Highest & Friday Lowest All Years
*Not all incidents reported a weekday
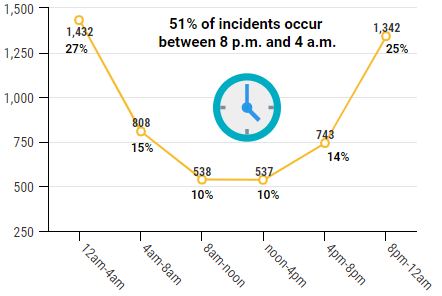
*Times not available for all days
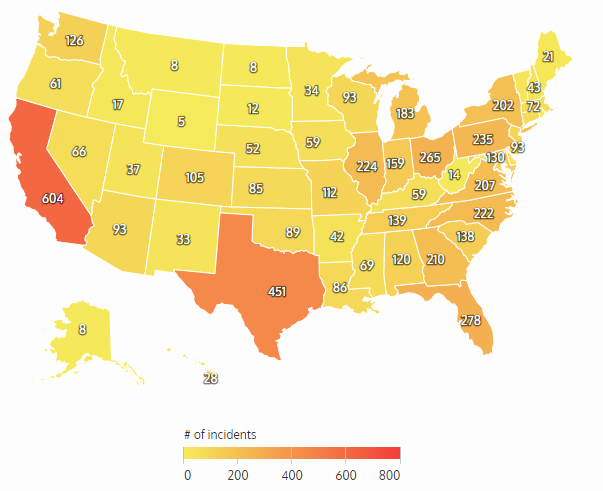
2019 Robberies by State California & Texas Highest 2016 to 2019
4 Yr. Average
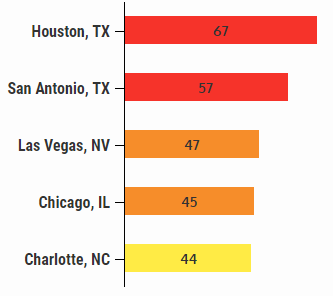
Houston Top City 3 of Last 4 Years
|
![]() Share on Facebook
Share on Facebook
![]() Share on Twitter
Share on Twitter
![]() Share on LinkedIn
Share on LinkedIn
|
|
Analysis of all three 2019 reports
(Retail Violent Fatalities, Robbery Report, and ORC Report) being published
immediately after releasing the ORC Report Monday March 9.
Methodology: The Daily collects this retail store specific information
from public news media sources throughout the United States and reports it daily
in our Retail Crime column. We do not survey any retailers or third parties nor
collect information from any retail executive. All of this information is
available through public news media outlets. We do not claim nor does it
represent all such incidents or deaths that may occur in retail locations or
retail corporate facilities as many may not be reported in the news media
depending on a number of variables outside of our control. We are not
responsible for the accuracy of the information reported in the various news
media outlets. We do not name any retailer, retail executive, suspect, or
victim.
Copyright: We reserve the rights to this industry exclusive
report and do not authorize its republication or reproduction without written
consent which may include a fee. By re-publishing or reproducing this report or
any parts of it without authorization the party agrees to pay a fee determined
by the D&D Daily.
Scarsdale Security
Sponsor of the D&D Daily’s Robbery Column
Thanks, Scarsdale, for making this column and this report possible.
Hey LP and AP Execs - Thank Scarsdale Security!
Thanks to David Raizen & Jim Mahoney at Scarsdale Security for sponsoring this report!
