|

The D&D Daily's
Exclusive - Publicly Reported
'Retail Violent Death Report' Q4 & Full Year 2018
Retail
Violent Deaths Up 30% Since 2016
488 Retail Violent Deaths
Up 15% in 2018
124 Retail Violent Deaths
Up 8.7% in Q4
See Our Analysis Here
2016 - 2017 - 2018
Yearly
Comparison
| |
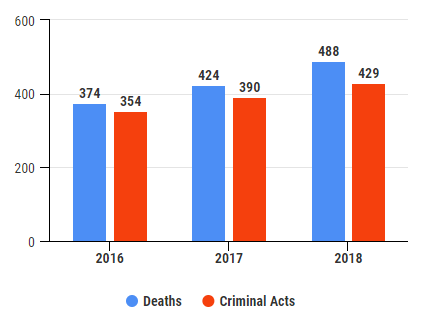
Deaths Up 15% since '17
Criminal Acts Up 10%
since '17
Deaths Up 30% since '16
Criminal Acts Up 21% since '16
2018 Totals
•
488 Retail Violent Deaths
•
429 Criminal Acts
2017 Totals
•
424 Retail Violent Deaths
•
390 Criminal Acts
2016 Totals
•
374 Retail Violent Deaths
•
354
Criminal Acts
|
|
4th
Quarter
2016 -
2017 - 2018
| |
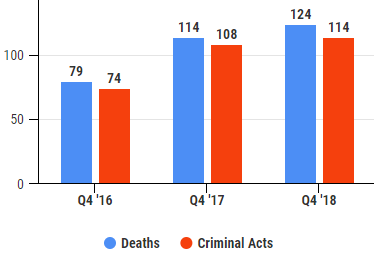
Q4 Deaths Up 8.7% since '17
Q4 Criminal Acts up 5.5% since '17
Q4 Deaths Up 57% since '16
Q4 Criminal Acts up 54% since '16
Q4 2018 Totals
•
124 Retail Violent Deaths
•
114 Criminal Acts
Q4 2017 Totals
•
114 Retail Violent Deaths
•
108 Criminal Acts
Q4 2016 Totals
•
79 Retail Violent Deaths
•
74 Criminal Acts
|
|
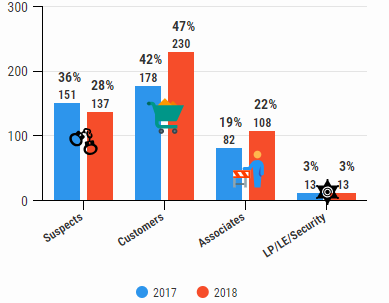
488 Retail Violent Deaths in 2018 by Category
28% Suspects - 72% Victims
137 Suspects,
230 Customers,
108
Associates,
13 LP/LE/Security
|
|
 488
Total
2018 Violent Deaths 488
Total
2018 Violent Deaths
•
28%,
137 Suspects - Down 9% from '17
• 47%,
230 Customers - Up 29% from '17
•
22%, 108 Associates - Up 32% from '17
•
3%, 13
LE/LP/Security - Same as '17
424 Total
2017 Violent Deaths
• 36%,
151 Suspects
• 42%,
178 Customers
•
19%, 82 Associates
•
3%, 13
LE/LP/Security
|
|
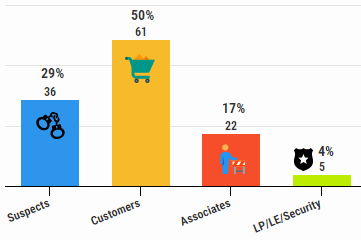
124 Q4 2018 Violent Deaths by
Category
29% Suspects - 71% Victims
36 Suspects,
61 Customers,
22 Associates,
5 LP/LE/Security
|
|
125
Q1 2018 Total Violent Deaths
•
28%, 35
Suspects – Down 33% from Q1 '17
•
50%, 62
Customers – Up 114% from Q1 '17
• 22%, 28
Associates - Up 8% from Q1 '17
114
Q2 2018 Total Violent Deaths
•
30%, 34 Suspects – No change from Q2 '17
•
47%, 54
Customers – Down 1.5% from Q2 '17
•
18%, 20 Associates - Up 43% from Q2 '17
•
5%, 6
LE/LP/Security - Up 50% from Q2 '17
125 Q3 2018 Total
Violent Deaths
•
26%, 32 Suspects – Up 14% from Q3 '17
•
42%, 53
Customers – Up 71% from Q3 '17
•
30%, 38 Associates - Up 65% from Q3 '17
•
2%, 2 LE/LP/Security - No change from Q3 '17
124 Q4 2018 Total Violent Deaths
•
29%, 36 Suspects – No change from Q4 '17
•
50%,
61 Customers – Up 7% from Q4 '17
•
17%, 22 Associates - Up 16% from Q4 '17
•
4%, 5 LE/LP/Security - Up 150% from Q4 '17
|
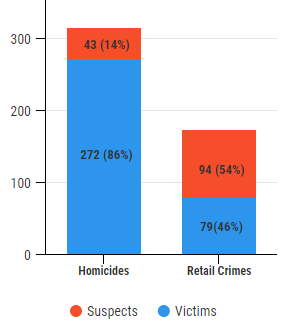
2018 Totals: 315 Homicides - 173 Retail Crime Deaths
Q4 Totals: 71 Homicides -
53 Retail Crime Deaths |
|
65% (315) of
'18 deaths were homicides
Arguments,
murder/suicides,
workplace violence, fire
•
14%,
43 Suspects
•
86%,
272 Victims
35% (173) of
'18 deaths occurred during retail crime
Robberies,
burglaries, shoplifting & carjacking
•
54%,
94 Suspects
•
46%,
79 Victims
57% (71) of Q4 deaths were homicides
Arguments,
murder/suicides,
workplace violence, fire
•
15%,
11 Suspects
•
85%,
60 Victims
43% (53) of
Q4 deaths occurred during retail crime
Robberies,
burglaries, shoplifting & carjacking
•
47%,
25 Suspects
•
53%,
28 Victims
57% (242) of
'17 deaths were homicides
Arguments,
murder/suicides,
workplace violence, fire
• 20%,
49 Suspects
•
80%,
193 Victims
43% (182) of '17 deaths occurred during retail crime
Robberies,
burglaries, shoplifting & carjacking
•
55%,
101 Suspects
•
45%,
81 Victims
|
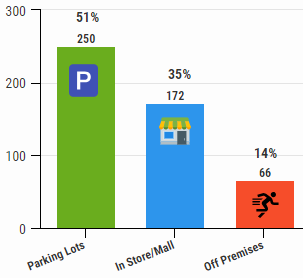
2018 &
Q4 Total Deaths In Parking Lot, In Store & Off Premises
|
|
2018
Totals
•
51%,
250 killed in parking lots
•
35%,
172 inside store or mall
•
14%,
66 died off premises
Q4 Totals
•
45%,
56 killed in parking lots
•
40%,
50 inside store or mall
•
14%,
18 died off premises
2017 Totals
•
50%,
214 killed in parking lots
•
37%,
156 inside store or mall
•
13%,
54 died off premises
|
|
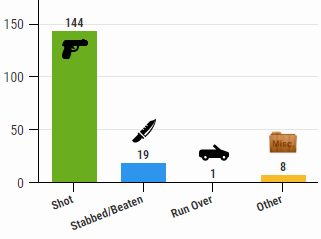
2018: 172
In-Store/Mall
Violent Deaths
Q4: 50
In-Store/Mall
Violent Deaths
|
|
2018 Totals
•
84%,
144 were shot
•
11%,
19 were stabbed/beaten
•
.5%,
1 run over
•
4.5%,
8 other
Q4 Totals
•
84%,
42 were shot
•
6%,
3 stabbed/beaten
•
2%, 1 run over
•
8%,
4 other
2017 Totals
•
88%,
137 were shot
•
10%,
15 stabbed/beaten
•
2%,
4 other
Other includes: medical reasons, drowning, drugs, police custody, fire &
n/a
|
2018: 351
Customers, Associates & Law Enforcement Killed
Q4: 88
Customers, Associates & Law Enforcement Killed
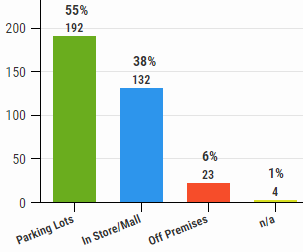 |
2018 Totals
•
55%,
192 killed outside the store
•
38%,
132 killed inside store/mall
•
6%,
23 killed off premises
•
1%,
4 n/a
Q4 Totals
•
54%,
48 killed outside the store
•
38%,
34 killed inside store/mall
•
7%,
6 killed
off premises
2017 Totals
•
54%,
151 killed outside the store
•
38%,
117 killed inside store/mall
•
7%,
5 killed
off premises
|
|
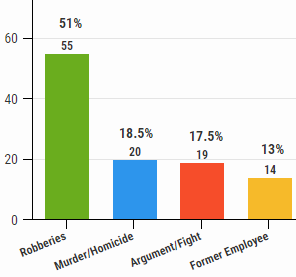
2018: 108 Associates Violently Killed
Q4: 22 Associates Violently Killed
|
2018 Totals
•
55 killed during robberies,
burglaries or thefts
•
19 killed in
argument/fight
•
20 killed in
murder/homicide/suicide
•
14 killed
by
former co-worker/relative/other
Q4 Totals
•
18 killed during robberies,
burglaries or thefts
•
2 killed in
argument/fight
•
1 killed in
murder/homicide
•
1 killed
by
former co-worker
2017 Totals
• 58
killed during robberies, burglaries or thefts
•
10 killed in
argument/fight
•
8 killed by former
c-worker
•
5 killed by
relative/customer
•
1 killed in
murder/homicide
|
|
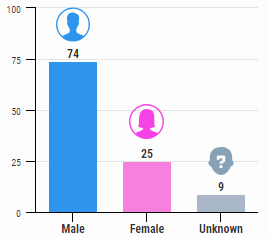
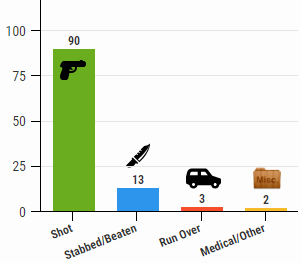
2018: 108 Associate Deaths by Gender & Method
Q4: 22 Associate Deaths By Gender & Method
|
 |
 |
|
2018 Totals
•
69%,
74 Males
•
23%,
25 Females
•
8%,
9 n/a
Q4 2018 Totals
•
73%,
16 Males
•
18%,
4 Females
•
9%,
2 n/a
2017 Totals
•
78%,
64 Males
•
18%,
15 Females
•
4%,
3 n/a
|
2018 Totals
•
83%,
90 Killed by gun
•
12%, 13
stabbed/beaten
•
3%,
3
run over
•
2%,
2
medical reasons/other
Q4 2018 Totals
•
82%,
18 Killed by gun
•
9%, 2
stabbed/beaten
•
4.5%,
1
run over
•
4.5%,
1
medical reasons
2017 Totals
•
83%,
72 Killed by gun
•
12%, 7
stabbed/beaten
•
3%,
3
other
|
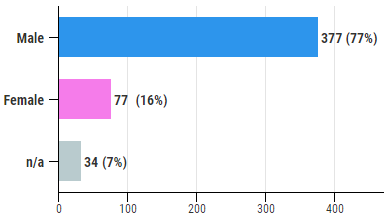
2018 & Q4 Deaths by Gender
|
2018 Totals
•
77%,
377 Males
•
16%,
77 Females
•
7%,
34 n/a
Q4 2018 Totals
•
72%,
89 Males
•
19%,
23 Females
•
9%,
12 n/a (includes 3 police K-9s)
2017 Totals
•
77%,
371 Males
•
16%,
42 Females
•
7%,
11 n/a
|

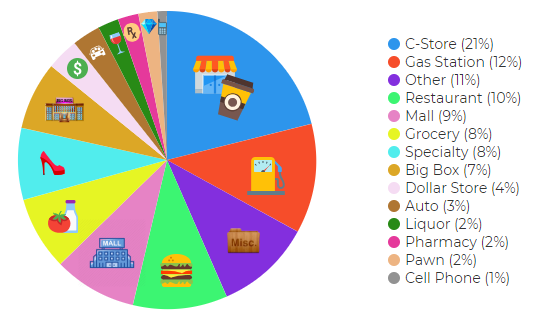
2018 Total Deaths by Store Type
|
2016
Totals:
1.
C-stores (26%)
2. Gas Stations (25%)
3. Big Box (21%)
4. Restaurants (9%)
5. Dollar Stores (8%)
|
2017
Totals:
1.
C-stores (18%)
2. Big Box (17%)
3. Gas Stations (12%)
4. Restaurants (9%)
5. Other (7%)
|
2018
Totals:
1.
C-stores (21%)
2. Gas Stations (12%)
3. Other (11%)
4. Restaurant (10%)
5. Mall (9%) |
Q4 2018:
1.
C-stores (20%)
2. Gas Stations (12%)
3. Grocery (11%)
4. Mall (10%)
5. Specialty (9%)
|
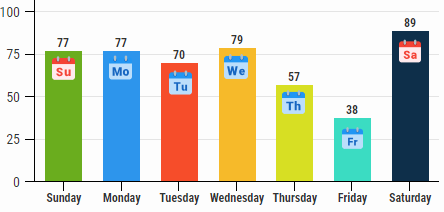
2018
Violent Deaths by Weekday
Saturday, Sunday, Monday Highest
2018
2017
2016 Days Ranked:
1. Sunday
2. Friday
3. Saturday
4. Wednesday
5. Monday
6. Tuesday
7. Thursday
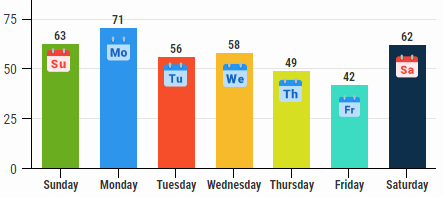
|
2017 Days Ranked:
1. Monday - 71
2. Sunday - 63
3. Saturday - 62
4. Wednesday - 58
5. Tuesday - 56
6. Thursday - 49
7. Friday - 42
|
2018 Days Ranked:
1. Saturday - 89
2. Wednesday - 79
3. Sunday - 77
4. Monday - 77
5. Tuesday - 70
6. Thursday - 57
7. Friday - 38
|
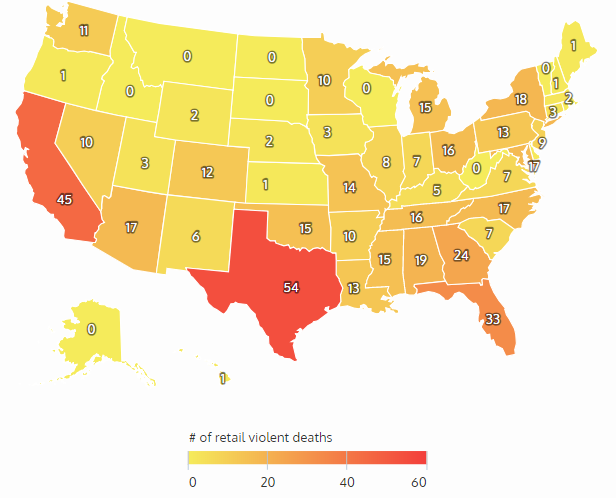
2018
Violent Deaths by State
Texas, California, Florida Most Deaths
2016 States
Ranked
1. Texas (43)
2. California (39)
3. Florida (31)
4. Georgia (23)
5. Ohio (17) |
2017 States Ranked
1. Texas (52)
2. California (49)
3. Georgia (27)
4. Florida (25)
5. Tennessee (17) |
2018 States
Ranked
1. Texas (54)
2. California (45)
3. Florida (33)
4. Georgia (24)
5. New York (18) |
Q4 2018 States Ranked
1. Florida (12)
2. California (9)
3. Texas (9)
4. New York (7)
5. Georgia (7) |
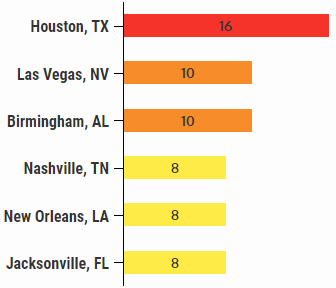
2018 Violent Deaths by City
Houston, Las Vegas & Birmingham Most Deaths
| |
2018 Top Cities
1. Houston, TX
2. Las Vegas, NV
2. Birmingham, AL
3. Nashville, TN
3. New Orleans, LA
3. Jacksonville, FL
2017 Top Cities
1. Houston, TX
2. Memphis, TN
3. Atlanta, GA
4. Las Vegas, NV
5. Colorado Springs, CO
2016 Top Cities
1. Houston, TX
2. Atlanta, GA
3. Detroit, MI
4. Phoenix, AZ
5. Chicago, IL |
2018
|
Methodology: The Daily collects this retail store specific information
from public news media sources throughout the United States and reports it daily
in our Retail Crime column. We do not survey any retailers or third parties nor
collect information from any retail executive. All of this information is
available through public news media outlets. We do not claim nor does it
represent all such incidents or deaths that may occur in retail locations or
retail corporate facilities as many may not be reported in the news media
depending on a number of variables outside of our control. We are not
responsible for the accuracy of the information reported in the various news
media outlets. We do not name any retailer, retail executive, suspect, or
victim.
Copyright: We reserve the rights to this industry exclusive
report and do not authorize its republication or reproduction without written
consent which may include a fee. By re-publishing or reproducing this report or
any parts of it without authorization the party agrees to pay a fee determined
by the D&D Daily.
 Share on Facebook
 Share on Twitter
 Share on LinkedIn
Security Resources
Sponsor of the D&D Daily's Retail
Crime Column
Thanks Security Resources for making this column and
report possible.
Hey LP and AP Execs - Thank Security Resources!
|
