|

The D&D Daily's Publicly Reported
'Retail Violent Death Report' Q2 and Mid-Year
239 Mid-Year
Retail Violent Deaths - Up 6.2% Over Mid-Year '17
114 Q2 Retail Violent Deaths - Flat to Q2 '17
464 Retail Violent Deaths 2017-2018 Mid-Year Trends
33% Suspects - 67% Victims
309 Victims - Customers - Associates - LP/LE Killed
155 Suspects Killed
 |
|
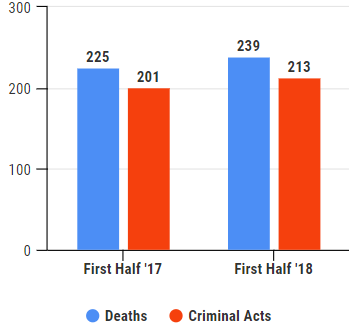
Mid-Year Comparison - '17 vs. '18
First Half of 2018
•
239 Retail violent deaths
•
213 Criminal acts
Compared to 2017
•
Deaths up 6.2% (225 in 1st half of
'17)
•
Criminal acts up 6% (201 in 1st half of
'17) |
|
|
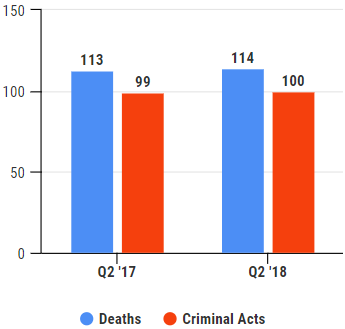
Quarterly Comparison - '17 vs. '18
Q2 2018
•
114
Retail violent deaths
•
100 Criminal acts
Compared to Q2 2017
•
Deaths up 1% (113 in Q2 '17)
•
Criminal acts up 1% (99 in Q2 '17) |
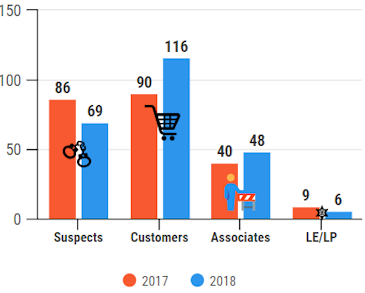
239 Mid-Year 2018 Violent Deaths
by Group
29% Suspects - 71% Victims
69 Suspects, 116 Customers, 48 Associates, 6 LP/LE/Security
|
|
239 Mid-Year '18 Total Violent Deaths
•
29%,
69 Suspects - Down 20% from '17
•
49%, 116
Customers - Up 29% from '17
•
20%, 48 Associates - Up 20% from '17
•
2%, 6
LE/LP/Security - Down 33% from '17
225
Mid-Year '17 Total Violent Deaths
•
38%,
86 Suspects
•
40%, 90
Customers
•
18%, 40 Associates
•
4%, 9
LE/LP/Security |
 |
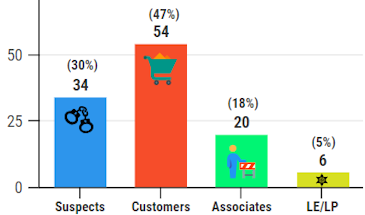
114 Q2 2018 Violent Deaths by
Group
30% Suspects - 70% Victims
34 Suspects,
54 Customers,
20 Associates, 6 LP/LE/Security
|
|
114
Q2 2018 Total Violent Deaths
•
30%, 34 Suspects – Down 3% from Q1
•
47%, 54
Customers – Down 13% from Q1
•
18%, 20 Associates - Down 28% from Q1
• 5%, 6
LE/LP/Security
125
Q1 2018 Total Violent Deaths
•
28%, 35
Suspects – Down 33% from Q1 '17
•
50%, 62
Customers – Up 114% from Q1 '17
• 22%, 28
Associates - Up 8% from Q1 '17
|
 |
|
Mid-Year Totals: 160 Homicides -
79
Retail Crime Deaths |
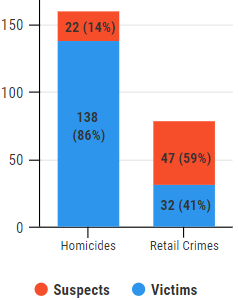 |
67%
(160) of deaths were homicides
Arguments,
murder/suicides
•
14%,
22 Suspects
•
86%, 138 Victims
33% (79) of deaths occurred during a retail crime
Robberies,
burglaries, shoplifting & carjacking
•
59%,
47 Suspects
•
41%,
32 Victims
|
Q2 Totals: 72 Homicides -
42 Retail Crime Deaths |
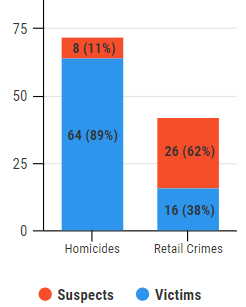 |
63% (72) of deaths were homicides
Arguments,
murder/suicides
•
11%,
8 Suspects
•
89%,
64 Victims
37% (42) of deaths occurred during a retail crime
Robberies,
burglaries, shoplifting & carjacking
•
62%,
26 Suspects
•
38%,
16 Victims
|
Deaths In Parking Lot, In Store & Off Premises
|
Mid-Year
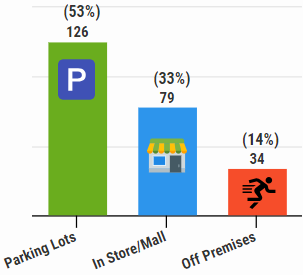
•
53%,
126 killed in parking lots
•
33%,
79 inside store or mall
•
14%, 34 died off premises
|
Q2
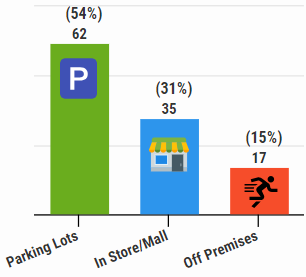
•
54%, 62 killed in parking lots
•
31%, 35 inside store or mall
•
15%, 17 died off premises
|
|
In-Store/Mall
Violent Deaths
|
Mid-Year
|
Q2
|
Customers, Associates & Law Enforcement Killed
Mid-Year - 170
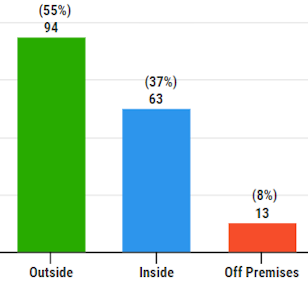
71% of total
deaths
•
55%,
94 killed outside the store
•
37%,
63 killed inside the store/mall
•
8%,
13 killed
off premises
|
Q2 - 80
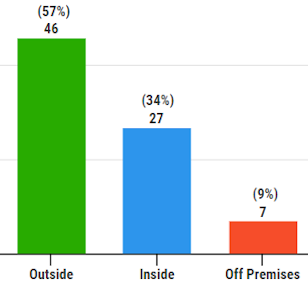
70% of total deaths
•
57%, 46 killed outside the store
•
34%, 27 killed inside the store/mall
•
9%, 7 killed
off premises
|
|
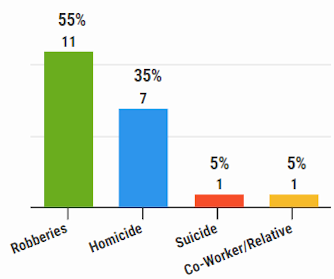
Q2: 20 Associates Violently Killed
|
18% of the total deaths
•
11 killed during robberies,
burglaries or thefts
•
7 killed in homicide
•
1 killed by suicide
•
1 killed
by
co-worker/employee/relative
|
|
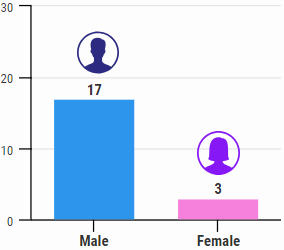
Q2: 20 Associate Deaths By Gender & Method
 |
 |
Males Killed 6 to 1
•
85%, 17 Males
•
15%, 3 Females
|
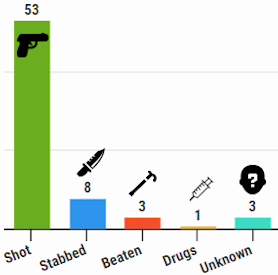
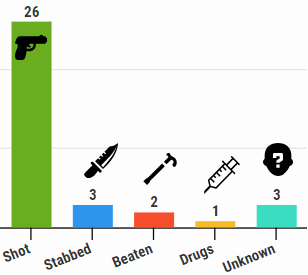
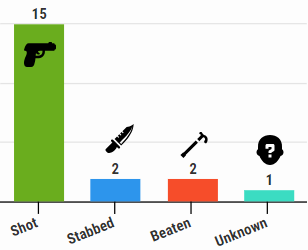
Method
•
75%, 15 Killed by gun
•
10%, 2
stabbed
•
10%, 2 beaten
•
5%,
1 not listed
|
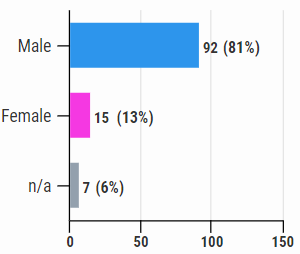
Q2 Total Deaths by Gender
|
Males Killed
By 81-13 Margin
•
81%, 92 Males
•
13%,
15 Females
•
6%,
7 Not listed |
Q2:
Total Deaths by Store Type
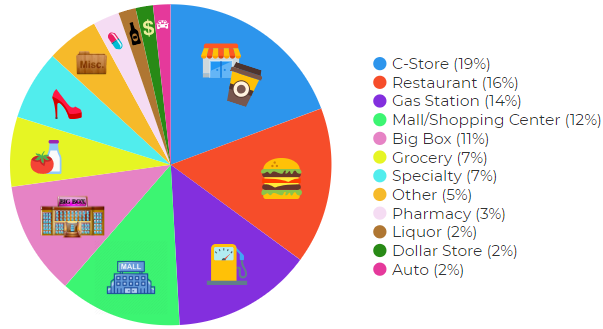
*Other category consists of pawn shop, flea market, gun range,
sweepstakes venue & check cashing
|
|
|
Q1 2018 Deaths by
Store Type:
1. C-stores
2. Other
3. Gas Stations
4. Shopping Center/Malls
5. Restaurants
|
Q2 2018 Deaths by
Store Type:
1. C-stores
2. Restaurant
3. Gas Stations
4. Shopping Center/Malls
5. Big Box
|
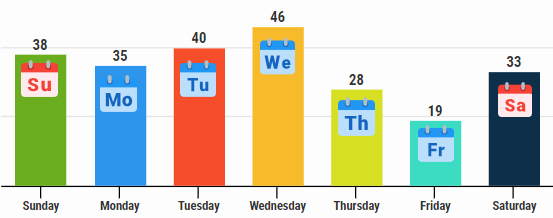
Violent Deaths by Weekday
Wednesday Top Day in 2018, Friday Lowest of Both Years
|
Mid-Year '18 Days
Ranked
1. Wednesday - 46
2. Tuesday - 40
3. Sunday - 38
4. Monday - 35
5. Saturday - 33
6. Thursday - 28
7. Friday - 19
|
Mid-Year '17 Days Ranked
1. Monday - 40
2. Sunday - 37
3. Saturday - 30
4. Wednesday - 27
5. Tuesday - 27
6. Thursday - 27
7. Friday 18
|
Combined Days Ranked
1. Monday - 75
2. Sunday - 75
3.
Wednesday - 73
4. Tuesday - 67
5. Saturday - 63
6. Thursday - 55
7. Friday 37
|
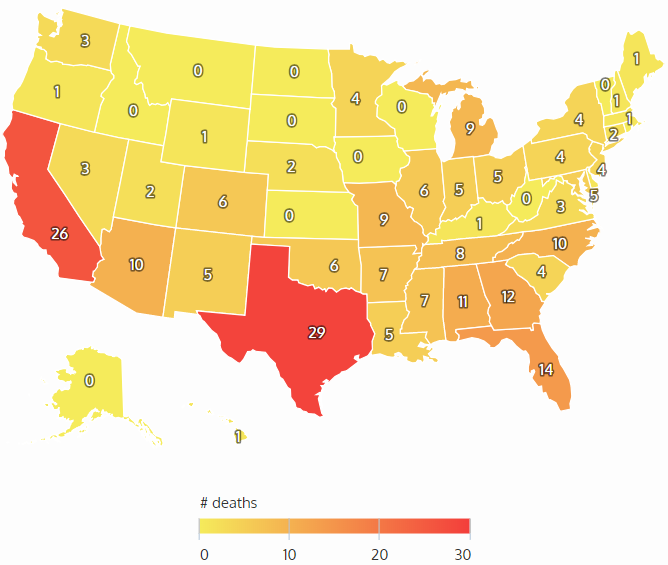
Violent Deaths by State
Texas, California Most Combined Mid-Year Deaths
|
Mid-Year 2018 States Ranked
1. Texas (29)
2. California (26)
3. Florida (14)
4. Georgia (12)
5. Alabama (11)
|
2017 States Ranked
1. Texas (52)
2. California (49)
3. Georgia (27)
4. Florida (25)
5. Tennessee (15)
|
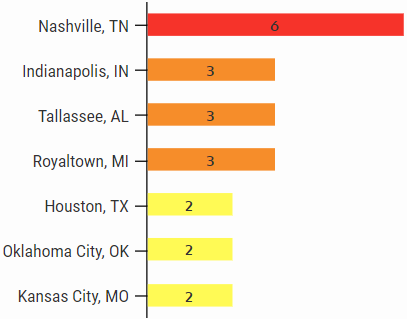
Violent Deaths by City
| |
Q2 2018 Top Cities
1. Nashville, TN (6)
2. Indianapolis, IN (3)
2. Tallassee, AL (3)
2. Royaltown, MI (3)
3. Houston, TX (2)
3. Oklahoma City, OK (2)
3. Kansas City, MO (2)
Q1 2018 Top Cities
1. Birmingham, AL (4)
2. Houston, TX (4)
3. Melcroft, NC (4)
4. Las Vegas, NV (3)
5. Jacksonville, FL (3) |
|
| |
Q1 2017 Top Cities
1. Houston, TX (5)
2. Memphis, TN (4)
3. Little Rock, AR (3)
4. Indianapolis, IN (3)
5. Atlanta, GA (3)
|
Q2 2017 Top Cities
1. Memphis, TN (5)
2. St. Louis, MO (3)
3. Las Vegas, NV (3)
4. Chicago, IL (2)
5. Atlanta, GA (2)
|
 Share on Facebook
 Share on Twitter
 Share on LinkedIn
Methodology: The Daily collects this retail store specific information
from public news media sources throughout the United States and reports it daily
in our Retail Crime column. We do not survey any retailers or third parties nor
collect information from any retail executive. All of this information is
available through public news media outlets. We do not claim nor does it
represent all such incidents or deaths that may occur in retail locations or
retail corporate facilities as many may not be reported in the news media
depending on a number of variables outside of our control. We are not
responsible for the accuracy of the information reported in the various news
media outlets. We do not name any retailer, retail executive, suspect, or
victim.
Copyright: We reserve the rights to this industry exclusive
report and do not authorize its republication or reproduction without written
consent which may include a fee. By re-publishing or reproducing this report or
any parts of it without authorization the party agrees to pay a fee determined
by the D&D Daily.
|
