|

The D&D Daily's
Exclusive - Publicly Reported
'Retail Fatalities Report' Q1 2019
Retail
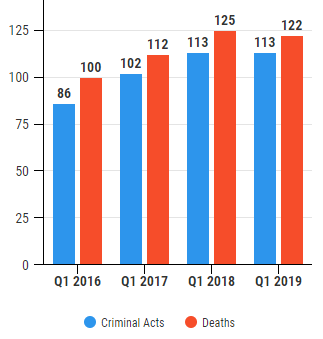
Fatalities Up 22% Since 2016
122
Retail Violent Deaths - Down 2% in Q1 from 2018
1st
Quarter
2016 -
2017 - 2018 - 2019
| |
Q1 Deaths Down 2% since '18
Q1 Criminal Acts Same since '18
Q1 Deaths Up 9% since '17
Q1 Criminal Acts Up 11% since '17
Q1 Deaths Up 22% since '16
Q1 Criminal Acts Up 31% since '16
Q1 2019 Totals
•
122 Retail Violent Deaths
•
113 Criminal Acts
Q1 2018 Totals
•
125 Retail Violent Deaths
•
113 Criminal Acts
Q1 2017 Totals
•
112 Retail Violent Deaths
•
102 Criminal Acts
Q1 2016 Totals
•
100 Retail Violent Deaths
•
86 Criminal Acts
|
 |
122 Retail Violent Deaths in
Q1 2019 by Category
34% Suspects - 66% Victims
41 Suspects,
59
Customers, 20
Associates,
2 LP/LE/Security
|
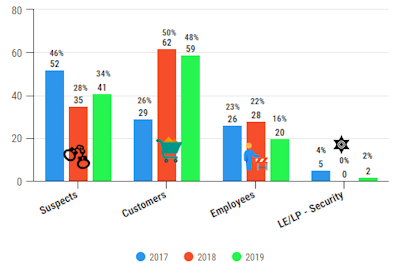 |
122
Total Q1 2019 Violent Deaths
•
34%,
41 Suspects - up 17% from '18
• 48%,
59 Customers - down 5% from '18
•
16%, 20 Associates - down 28% from '18
•
2%, 2
LE/LP/Security
125
Total Q1
2018 Violent Deaths
•
28%,
35 Suspects - down 32% from '17
• 50%,
62 Customers - up 112% from '17
•
22%, 28 Associates - up 8% from '17
•
0%, 0 LE/LP/Security
112
Total Q1
2017 Violent Deaths
• 46%,
52 Suspects
• 26%,
29 Customers
•
23%, 26 Associates
•
4%, 5
LE/LP/Security
|
|
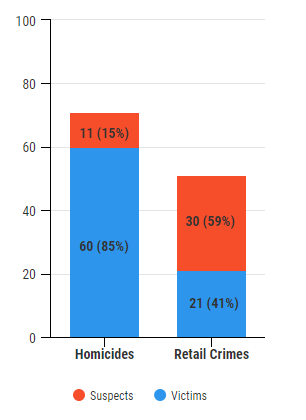
Q1 Totals: 71 Homicides -
51 Retail Crime Deaths |
|
58% (71) of Q1 '19 deaths were homicides
Arguments,
murder/suicides,
workplace violence, fire
•
15%, 11 Suspects
•
85%, 60 Victims
42% (51) of
Q1 '19 deaths occurred during retail crime
Robberies,
burglaries, shoplifting & carjacking
•
59%, 30 Suspects
•
41%, 21 Victims
70% (88) of
Q1 '18 deaths were homicides
Arguments,
murder/suicides,
workplace violence, fire
•
16%, 14 Suspects
•
84%, 74 Victims
30% (37) of Q1 '18 deaths occurred during retail crime
Robberies,
burglaries, shoplifting & carjacking
•
56%, 21
Suspects
•
43%, 16 Victims
46% (52) of
Q1 '17 deaths were homicides
Arguments,
murder/suicides,
workplace violence, fire
•
44%, 23 Suspects
•
56%, 29 Victims
53% (60) of '17 deaths occurred during retail crime
Robberies,
burglaries, shoplifting & carjacking
•
48%, 29
Suspects
•
52%, 31 Victims
|
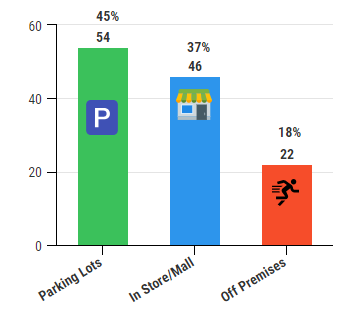
Q1 Total Deaths In Parking Lot, In Store & Off Premises
|
|
Q1 2019
Totals
•
45%,
54 killed in parking lots
•
37%, 46 inside store or mall
•
18%, 22 died off premises
Q1 2018 Totals
•
51%, 64 killed in parking lots
•
35%, 44 inside store or mall
•
14%, 17 died off premises
Q1
2017 Totals
•
57%, 64
killed in parking lots
•
37%, 41 inside store or mall
•
6%, 7 died off premises
|
|
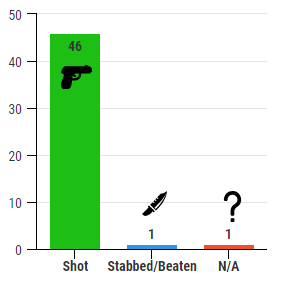
Q1: 46
In-Store/Mall
Violent Deaths
|
|
Q1
2019 Totals
•
96%, 44 were shot
•
2%, 1 was stabbed/beaten
•
2%,
1 n/a
Q1 2018 Totals
•
86%, 38 were shot
•
14%, 6 stabbed/beaten
Q1 2017 Totals
•
83%, 34 were shot
•
17%, 7 stabbed/beaten
|
Q1: 81
Customers, Associates & Law Enforcement Killed
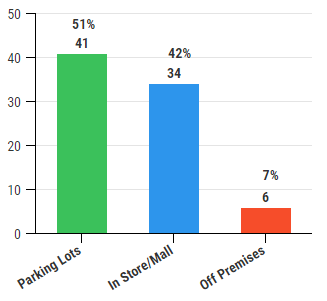 |
Q1 2019 Totals
•
51%,
41 killed outside the store
•
42%,
34 killed inside store/mall
•
7%, 6 killed off premises
Q1 2018 Totals
•
53%, 48 killed outside the store
•
40%, 36 killed inside store/mall
•
6%,
6 killed off premises
Q1 2017 Totals
•
59%, 49 killed
outside the store
•
38%, 32 killed
inside store/mall
•
3%, 3 killed off premises
|
|
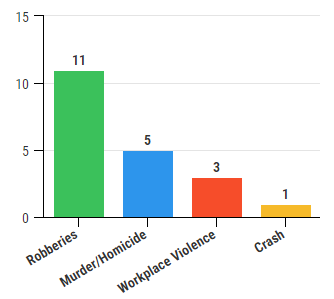
Q1: 20 Associates Violently Killed
|
Q1 2019 Totals
• 11 killed during robberies,
burglaries or thefts
•
5 killed in
murder/homicide/suicide
• 3 killed in workplace
violence/co-worker
•
1 killed
in crash
Q1
2018 Totals
• 11 killed during robberies,
burglaries or thefts
•
11 killed in
murder/homicide/suicide
•
4 killed in workplace violence
•
1 killed in accident
•
1 killed
by
former co-worker/relative/other
Q1
2017 Totals
• 24
killed during robberies, burglaries or thefts
•
1 killed by former
co-worker
•
1 killed by
relative/customer
|
|
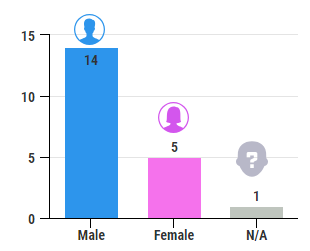
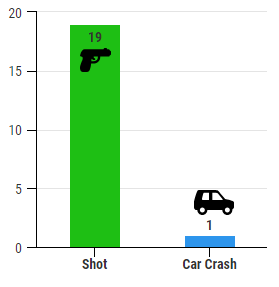
Q1: 20 Associate Deaths By Gender & Method
|
 |
 |
|
Q1
2019 Totals
•
70%,
14 Males
•
25%,
5 Females
•
5%,
1 n/a
Q1
2018 Totals
•
57%,
16 Males
•
36%,
10 Females
•
7%,
2 n/a
Q1
2017 Totals
•
73%,
19 Males
•
27%,
7 Females
|
Q1 2019 Totals
•
95%,
19 Killed by gun
•
5%, 1
car crash
Q1 2018 Totals
•
86%,
24 Killed by gun
•
11%, 3
stabbed/beaten
•
3%,
1
run over
Q1 2017 Totals
•
77%,
20 Killed by gun
•
19%, 5
stabbed/beaten
•
4%,
1 fire
|
Q1 Deaths by Gender
|
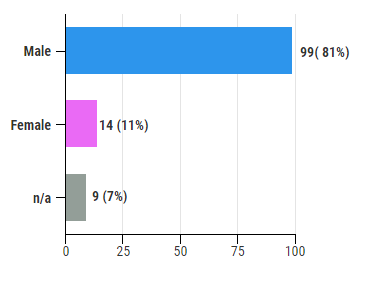 |
Q1 2019 Totals
•
81%, 99 Males
•
11%, 14 Females
•
7%, 9 n/a
Q1 2018 Totals
•
77%,
96 Males
•
18%,
23 Females
•
5%,
6 n/a
Q1 2017 Totals
•
89%, 100 Males
•
9%,
10 Females
•
3%, 4 n/a
|

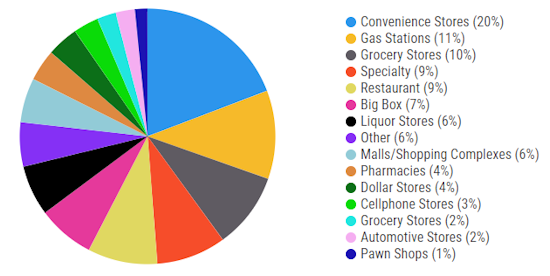
2019 Total Deaths by Store Type
|
2016
Totals:
1.
C-stores (26%)
2. Gas Stations (25%)
3. Big Box (21%)
4. Restaurants (9%)
5. Dollar Stores (8%)
|
Q1 2017
Totals:
1.
C-stores (28%)
2. Restaurants (15%)
3. Big Box (14%)
4. Other (9%)
5. Grocery Stores (5%)
|
Q1 2018
Totals:
1.
C-stores (19%)
2. Other (13.6%)
3. Gas Stations (12.8)
4. Malls/Shopping Centers (9.6%)
5. Restaurants (8.8%) |
Q1 2019 Totals:
1.
C-stores (20%)
2. Gas Stations (11%)
3. Grocery (10%)
4. Restaurants (9%)
5. Specialty (9%) |
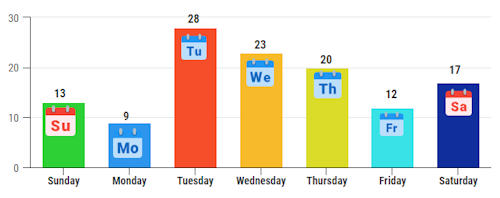
Q1
Violent Deaths by Weekday
Weekends, Wednesday & Tuesday Highest
2016
Days Ranked:
1. Sunday
2. Friday
3. Saturday
4. Wednesday
5. Monday
6. Tuesday
7. Thursday
|
Q1
2017
Days Ranked:
1. Saturday - 19
2. Monday - 19
3. Sunday - 18
4. Tuesday - 17
5. Wednesday - 16
6. Thursday - 14
7. Friday - 7
|
Q1 2018
Days Ranked:
1. Wednesday - 31
2. Sunday - 19
3. Monday - 19
4. Tuesday - 17
5. Thursday - 16
6. Saturday - 16
7. Friday - 7
|
Q1 2019
Days Ranked:
1. Tuesday - 28
2. Wednesday - 23
3. Thursday - 20
4. Saturday - 17
5. Sunday - 13
6. Friday - 12
7. Monday - 9
|
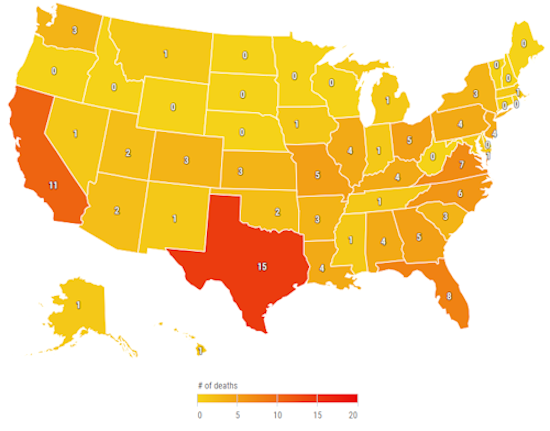
Q1
Violent Deaths by State
Texas & California Top 2 in Most Deaths
2016 States
Ranked
1. Texas (43)
2. California (39)
3. Florida (31)
4. Georgia (23)
5. Ohio (17) |
Q1 2017 States Ranked
1. Texas (15)
2. California (12)
3. Georgia (9)
4. FL & NC (7 each)
5. AR & TN (5 each) |
Q1
2018 States
Ranked
1. Texas (17)
2. California (16)
3. North Carolina (8)
4. Florida (7)
5. GA, AL & AZ (6) |
Q1 2019 States Ranked
1. Texas (15)
2. California (11)
3. Florida (8)
4. Virginia (7)
5. North Carolina (6) |
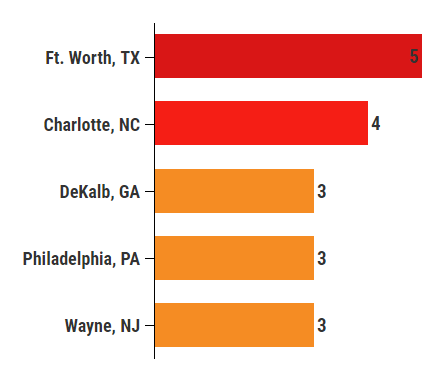
Q1 Violent Deaths by City
Houston & Birmingham Most Deaths
| |
Q1 2019 Top Cities
1. Ft. Worth, TX
2. Charlotte, NC
3. DeKalb, GA
3. Philadelphia, PA
3. Wayne, NJ
Q1
2018 Top Cities
1. Birmingham, AL
2. Houston, TX
3. Melcroft, NC
4. Las Vegas, NV
5. Jacksonville, FL
Q1
2017 Top Cities
1. Houston, TX
2. Memphis, TN
3. Little Rock, AR
4. Indianapolis, IN
5. Atlanta, GA
2016 Top Cities
1. Houston, TX
2. Atlanta, GA
3. Detroit, MI
4. Phoenix, AZ
5. Chicago, IL |
Q1
 |
Methodology: The Daily collects this retail store specific information
from public news media sources throughout the United States and reports it daily
in our Retail Crime column. We do not survey any retailers or third parties nor
collect information from any retail executive. All of this information is
available through public news media outlets. We do not claim nor does it
represent all such incidents or deaths that may occur in retail locations or
retail corporate facilities as many may not be reported in the news media
depending on a number of variables outside of our control. We are not
responsible for the accuracy of the information reported in the various news
media outlets. We do not name any retailer, retail executive, suspect, or
victim.
Copyright: We reserve the rights to this industry exclusive
report and do not authorize its republication or reproduction without written
consent which may include a fee. By re-publishing or reproducing this report or
any parts of it without authorization the party agrees to pay a fee determined
by the D&D Daily.
 Share on Facebook
 Share on Twitter
 Share on LinkedIn
Security Resources
Sponsor of the D&D Daily's Retail
Crime Column
Thanks Security Resources for making this column and
report possible.
Hey LP and AP Execs - Thank Security Resources!
|
