&uuid=(email))

Most Robberies & Burglaries Ever
Reported
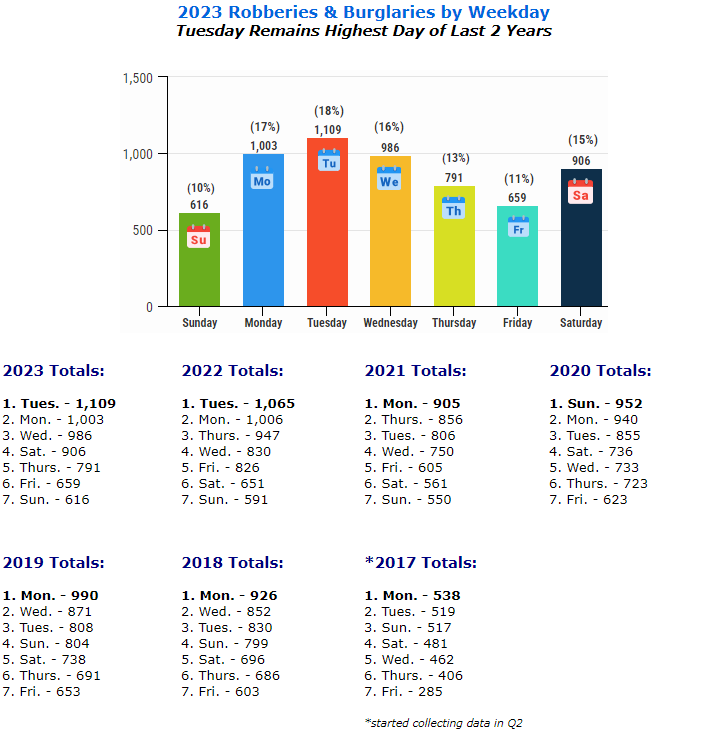
Robberies Up 21% Over Last 2 Years, Up 3% From 2022
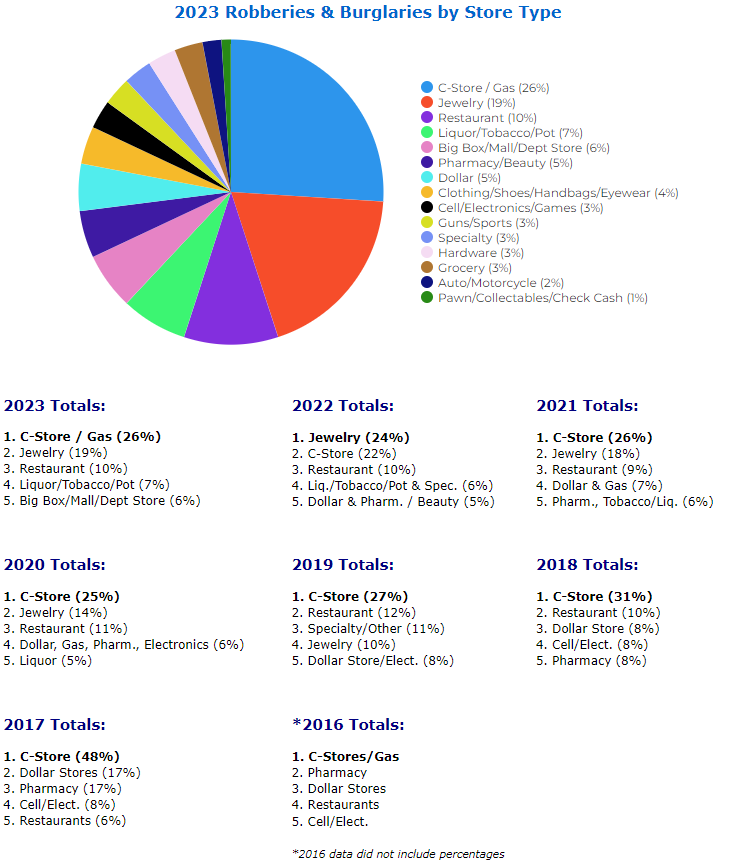
C-Stores
Top Targeted Store 7 of 8 Years -
Tuesday Top Day
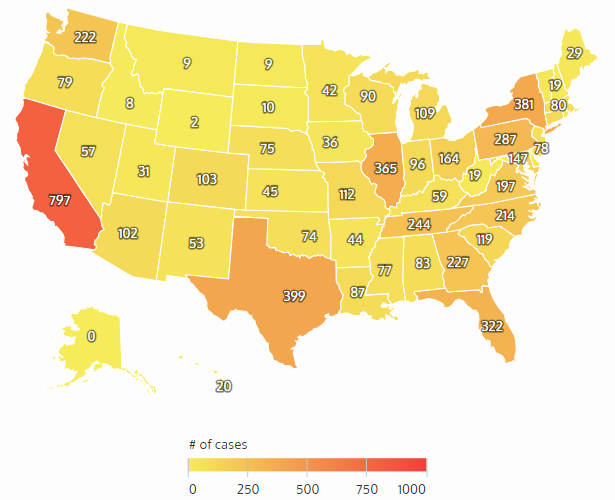
Calif. Remains Top State - Chicago #1 Robbery Hot Spot
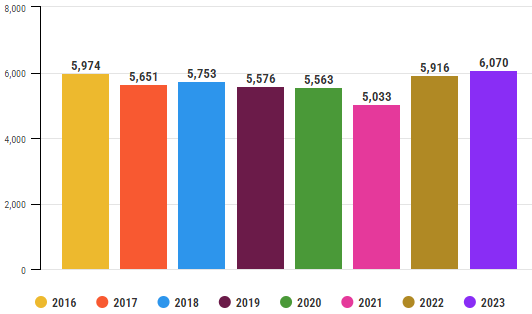
Yearly Robbery & Burglary Comparison
|
2016-2023
Up 3% From 2022, Up 2% Overall Since 2016
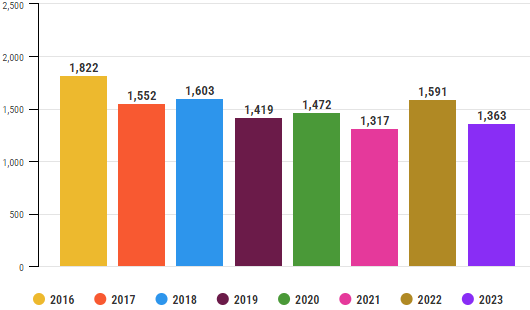
Q4 Robbery & Burglary Comparison | 2016-2023
Down 14% From 2022, Down 25% From 2016
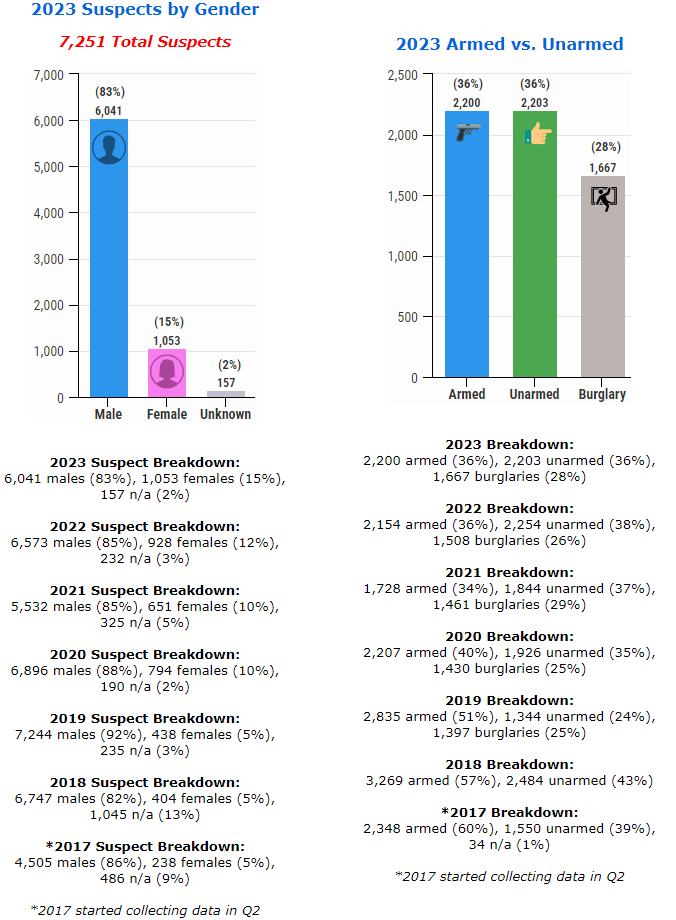
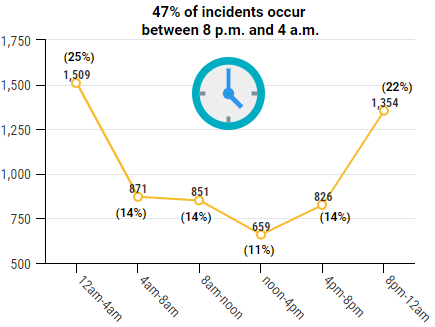
2023 Robberies
& Burglaries by Time of Day
|
2023 Times: |
2022 Times: |
2021 Times: |
2020 Times: |
|
|
|
|
|
2023 Robberies & Burglaries by State
California Highest Since 2017
|
2023 Top 5: |
2022 Top 5: |
2021 Top 5: |
2020 Top 5: |
|
2019 Top 5: |
2018 Top 5: |
2017 Top 5: |
2016 Top 5: |
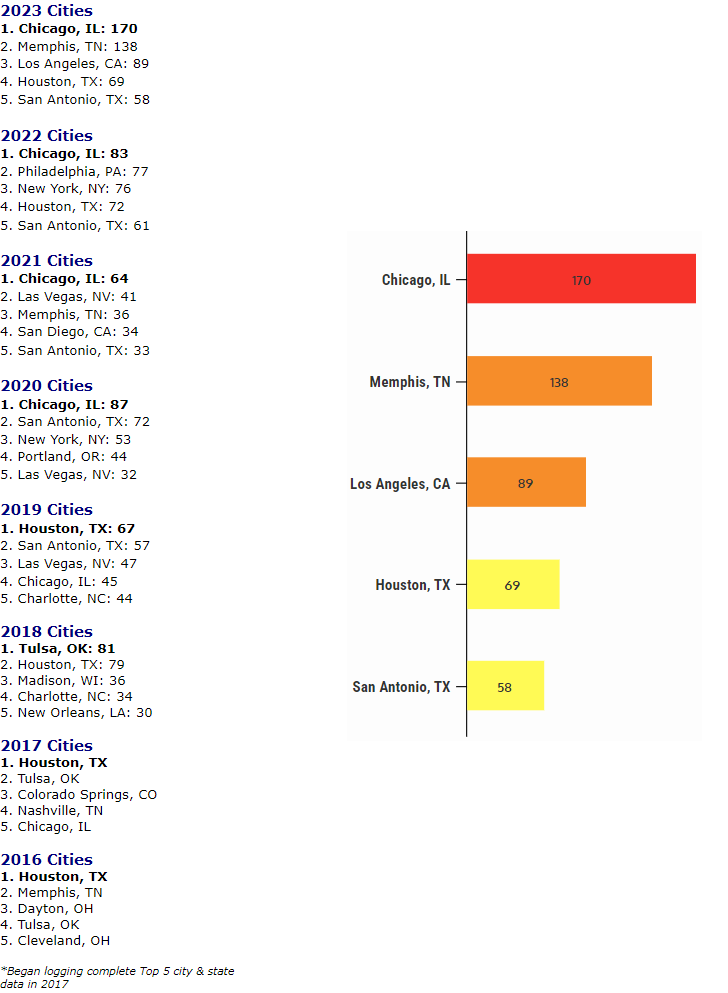
2023 Robberies & Burglaries by City
Chicago Top Robbery Hot Spot
Last Four Years
![]() Share on Facebook
Share on Facebook
![]() Share on Twitter
Share on Twitter
![]() Share on LinkedIn
Share on LinkedIn
|
|
Methodology: The Daily collects this retail store specific information
from public news media sources throughout the United States and reports it daily
in our Retail Crime column. We do not survey any retailers or third parties nor
collect information from any retail executive. All of this information is
available through public news media outlets. We do not claim nor does it
represent all such incidents or deaths that may occur in retail locations or
retail corporate facilities as many may not be reported in the news media
depending on a number of variables outside of our control. We are not
responsible for the accuracy of the information reported in the various news
media outlets. We do not name any retailer, retail executive, suspect, or
victim.
Copyright: We reserve the rights to this industry exclusive
report and do not authorize its republication or reproduction without written
consent which may include a fee. By re-publishing or reproducing this report or
any parts of it without authorization the party agrees to pay a fee determined
by the D&D Daily.