|

Retail
Violent Fatalities Still Up 36.7% Over Pre-Pandemic 2019
681 Retail Fatalities
in 2023 - Down 1.9% From 2022
155 Q4 2023 Fatalities - Down 10% From Q4 2022
Associate Fatalities
Down 20%, Suspect Fatalities Up 21%
C-Stores Remain #1 Most Dangerous Retailer - 34% of Fatalities
Los Angeles Replaces Houston as Most Dangerous City
Texas Barely Holds on to Most Dangerous State
|
Yearly Comparison | 2017-2023
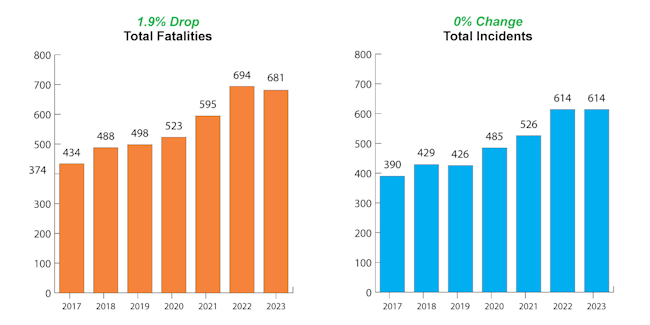
•
Fatalities up
57% from 2017 but down 1.9% from 2022
•
Incidents up 57% from 2017 but flat from
2022
|
|
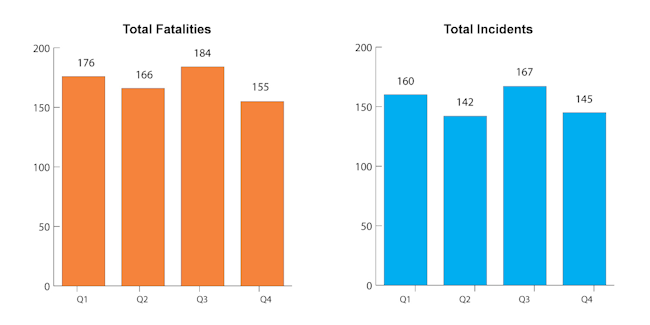
Q4 Comparison | 2017-2023

•
Fatalities up
36% from Q4 2017 but down 10% from Q4 2022
•
Incidents up 34% from Q4 2017 but
down 3%
from Q4 2022
|
|
2023 Incidents & Fatalities by Quarter
|
2023's 681 Retail Violent Fatalities by Category
80% Victims - 20% Suspects
56%
Customers - 20% Associates -
4% LP/LE/Security -
20% Suspects

681 Total 2023 Fatalities
•
20%,
136 Suspects -
Up 21% from '22
•
56%,
380 Customers - flat from '22
•
20%, 136 Associates - Down 20% from '22
•
4%, 29 LE/LP/Security - Down 6% from '22 |
|
694 Total 2022 Fatalities
•
16%,
112 Suspects
•
55%,
381 Customers
•
24%, 170 Associates
•
5%, 31 LE/LP/Security |
595 Total 2021
Fatalities
•
18%,
108 Suspects
•
53%,
317 Customers
•
26%, 152 Associates
•
3%, 18 LE/LP/Security |
|
523 Total 2020
Fatalities
•
24%,
128 Suspects
• 49%,
256 Customers
•
24%, 123 Associates
•
3%, 16 LE/LP/Security |
|
498 Total 2019
Fatalities
•
28%,
141 Suspects
•
52%,
257 Customers
•
17%, 87 Associates
•
3%, 13 LE/LP/Security
|
|
488 Total 2018 Fatalities
•
28%, 137 Suspects
•
47%, 230 Customers
•
22%, 108 Associates
•
3%, 13 LE/LP/Security
|
|
|
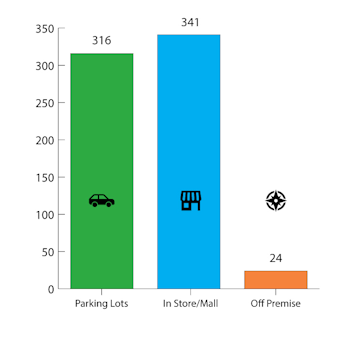
2023 Fatalities
by Location
50% In-Store/Mall -
46% Parking Lots - 4% Off Premises
|
|
2023 Totals
•
50%, 341 in-store
/ mall
•
46%,
316 killed in parking lots
•
4%, 24 died off
premises
2022
Totals
•
53%,
366 killed in parking lots
•
43%, 296 in-store
•
3%, 22 died off
premises
•
1%, 10 mall
premises
2021
Totals
•
45%,
268 killed in parking lots
•
50%, 296 inside
store or mall
•
5%, 31 died off
premises
2020
Totals
•
48%,
251 killed in parking lots
•
47%, 247 inside store or mall
•
5%, 25 died off premises
2019
Totals
•
43%,
216 killed in parking lots
•
46%, 227 inside store or mall
•
11%, 55 died off premises
2018
Totals
•
51%,
250 killed in parking lots
•
35%,
172 inside store or mall
•
14%, 66 died off premises
2017 Totals
•
50%, 214 killed in parking lots
•
37%,
156 inside store or mall
•
13%, 54 died off premises
|
|
In-Store as
Dangerous as Parking Lots?
Last Five Years Says Yes
Two out of last three years in-store fatalities outnumbered parking lot
fatalities, with the preceding two years coming within one and three
percentage points, respectively, of being the #1 location.
So, four out of the last five years, in-store fatalities have become as
dangerous as the parking lots of America.
Couple that with 2022’s COVID store closures, it may not be a stretch to think
the trend was merely interrupted.
Proving that all of the discussions and media coverage of the increase of
in-store violence is not only valid, it’s absolutely necessary until we find how
to curb and hopefully stop this trend.
|
|
|
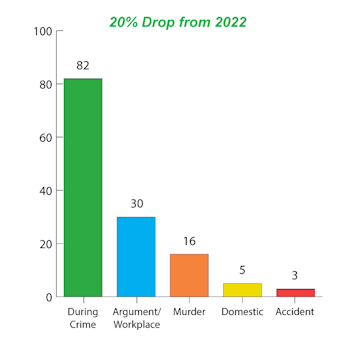
2023: 136 Associate Fatalities
60% Commission of Crime, 22% Workplace
Violence
15% Murder/Domestic Violence, 2% Accidental
|
|
2023 Totals
•
82 killed during robberies,
burglaries or thefts
•
30 killed in
argument/co-worker/workplace violence
•
21 killed in
murder/domestic violence
•
3 killed in accident
2022 Totals
•
132 killed during robberies,
burglaries or thefts
•
21 killed in
argument/co-worker/workplace violence
•
25 killed in
murder/homicide/suicide
•
2 killed in accident
2021 Totals
•
93 killed during robberies,
burglaries or thefts
•
32 killed in
argument/co-worker/workplace violence
•
20 killed in
murder/homicide/suicide
•
7 killed in accident
2020 Totals
•
87 killed during robberies,
burglaries or thefts
•
23 killed in
argument/co-worker/workplace violence
•
7 killed in
murder/homicide/suicide
•
6 killed in accident
2019 Totals
•
54 killed during robberies,
burglaries or thefts
•
16 killed in
argument/co-worker/workplace violence
•
11 killed in
murder/homicide/suicide
•
6 killed in accident
2018 Totals
•
55 killed during robberies,
burglaries or thefts
•
19 killed in
argument/fight
•
20 killed in
murder/homicide/suicide
•
14 killed
by
former co-worker/relative/other
2017 Totals
• 58
killed during robberies, burglaries or thefts
•
10 killed in
argument/fight
•
8 killed by former
c-worker
•
5 killed by
relative/customer
•
1 killed in
murder/homicide
|
|
&uuid=(email))
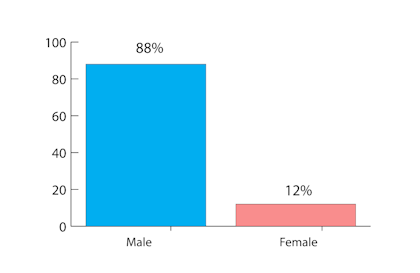
2023 Total Fatalities by Gender
88% Male - 12% Female
|
|
2023 Totals
•
88%,
599 Males
•
12%, 82 Females
2022 Totals
•
89%, 618 Males
•
11%, 76 Females
2021 Totals
•
86%,
511 Males
•
14%,
84 Females
2020 Totals
•
85%,
447 Males
•
15%,
76 Females
2019 Totals
•
83%,
411 Males
•
15%,
76 Females
•
2%, 11 n/a
2018 Totals
•
77%,
377 Males
•
16%,
77 Females
•
7%,
34 n/a
2017 Totals
•
77%,
371 Males
•
16%,
42 Females
•
7%,
11 n/a
|
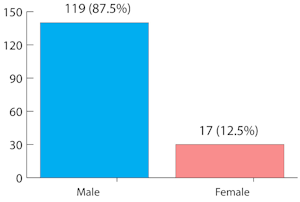
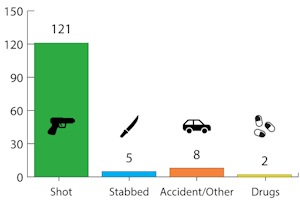
2023: 136 Associate Fatalities By Gender & Method
|
|
|
|
|
|
2023 Totals
•
87.5%,
119 Males
•
12.5%,
17 Females
2022 Totals
•
82%,
140 Males
•
18%,
30 Females
2021 Totals
•
85%,
129 Males
•
15%,
23 Females
2020 Totals
•
88%,
108 Males
•
12%,
15 Females
2019 Totals
•
79%, 69 Males
•
20%,
17 Females
•
1%,
1 n/a
2018 Totals
•
69%,
74 Males
•
23%,
25 Females
•
8%,
9 n/a
2017 Totals
•
78%,
64 Males
•
18%,
15 Females
•
4%,
3 n/a
|
2023 Totals
•
89%, 121 shot
•
4%, 5 stabbed
•
6%, 8 accident/other
•
1%, 2 drugs
2022 Totals
•
94%, 160 shot
•
2%, 4 stabbed/beaten
•
5%, 7 accident/car crash/other
2021 Totals
•
93%, 142
shot
•
2%, 3 stabbed/beaten
•
5%, 7 accident/car crash/other
2020 Totals
•
88%, 109
shot
•
7%, 8 stabbed/beaten
•
5%, 6 car crash/other
2019 Totals
•
85%, 74
shot
•
10%, 8 stabbed
•
5%, 5 fire/accident/crash/other
2018 Totals
•
83%,
90 Killed by gun
•
12%, 13
stabbed/beaten
•
3%,
3
run over
•
2%, 2 medical reasons/other
2017 Totals
•
83%,
72 Killed by gun
•
12%, 7
stabbed/beaten
•
3%,
3
other
|
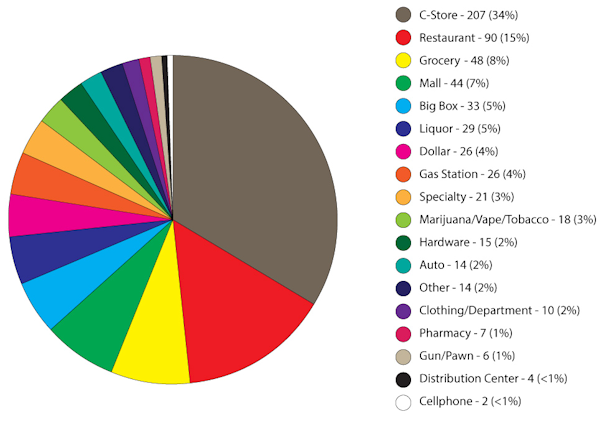
2023 Fatality Incidents by Store Type
C-Stores Top Store Type Seven Straight Years
|
2023:
1. C-stores (34%)
2. Restaurants (15%)
3. Grocery (8%)
4. Mall (7%)
5. Big Box (5%) |
2022:
1. C-stores (32%)
2. Restaurants (19%)
3. Gas Station (8%)
4. Grocery (6%)
5. Mall (5%)
|
2021:
1.
C-stores (34%)
2. Restaurants (18%)
3. Grocery (8%)
4. Gas Station (7%)
5. Specialty (5%)
|
2020:
1.
C-stores (34%)
2. Restaurants (16%)
3. Gas Station (9%)
4. Mall (7%)
5. Grocery (7%)
|
2019:
1.
C-stores (26%)
2. Restaurants (16%)
3. Gas Station (9%)
4. Specialty (8%)
5. Big Box (8%) |
2018:
1.
C-stores (21%)
2. Gas Stations (12%)
3. Other (11%)
4. Restaurant (10%)
5. Mall (9%)
|
2017:
1.
C-stores (18%)
2. Big Box (17%)
3. Gas Stations (12%)
4. Restaurants (9%)
5. Other (7%)
|
|
2023 Fatality Incidents by Weekday
Wednesday highest & Saturday lowest for first time since tracking began
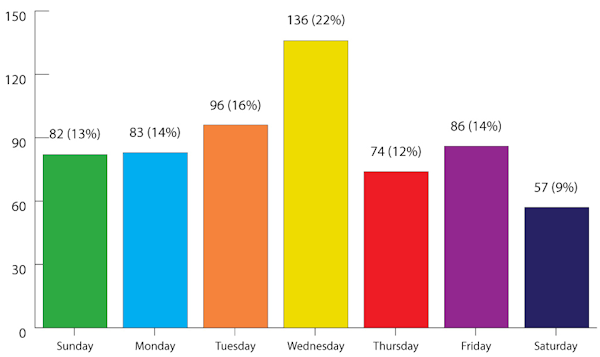
2023:
1. Wednesday - 136
2. Tuesday - 96
3. Friday - 86
4. Monday - 83
5. Sunday - 82
6. Thursday - 74
7. Saturday - 57 |
2022:
1. Monday - 104
2. Sunday - 102
3. Thursday - 98
4. Wednesday - 86
5. Tuesday - 85
6. Saturday - 72
7. Friday - 67
|
2021:
1. Tuesday - 90
2. Monday - 82
3. Saturday - 77
4. Sunday - 70
5. Wednesday - 70
6. Thursday - 70
7. Friday - 49
|
2020:
1. Tuesday - 84
2. Wednesday - 82
3. Monday - 77
4. Saturday - 72
5. Sunday - 66
6. Thursday - 55
7. Friday - 49
|
2019:
1. Tuesday - 78
2. Wednesday - 74
3. Thursday - 65
4. Monday - 63
5. Saturday - 63
6. Sunday - 60
7. Friday - 38 |
2018:
1. Saturday - 89
2. Wednesday - 79
3. Sunday - 77
4. Monday - 77
5. Tuesday - 70
6. Thursday - 57
7. Friday - 38
|
2017:
1. Monday - 71
2. Sunday - 63
3. Saturday - 62
4. Wednesday - 58
5. Tuesday - 56
6. Thursday - 49
7. Friday - 42 |
|
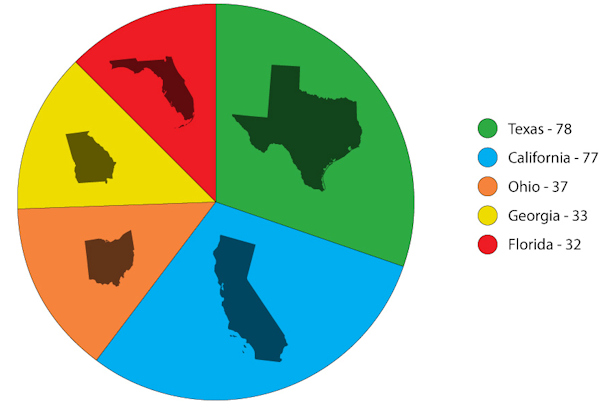
2023 Fatality Incidents by State
Texas & California Top
States for 7 Straight Years
2023:
1. Texas (78)
2. California (77)
3. Ohio (37)
4. Georgia (33)
5. Florida (32) |
2022:
1. Texas (73)
2. California (64)
3. Georgia (49)
4. Florida (33)
5. Pennsylvania (32) |
2021:
1. Texas (66)
2. California (44)
3. Georgia (30)
4. Tennessee (26)
5. FL & PA (25)
|
2020:
1. California (65)
2. Texas (44)
3. Florida (36)
4. Georgia & NC (25)
5. Michigan (19)
|
2019:
1. California (46)
2. Texas (44)
3. Florida (31)
4. Georgia (27)
5. North Carolina (21)
|
2018:
1. Texas (54)
2. California (45)
3. Florida (33)
4. Georgia (24)
5. New York (18) |
2017:
1. Texas (52)
2. California (49)
3. Georgia (27)
4. Florida (25)
5. Tennessee (17) |
|
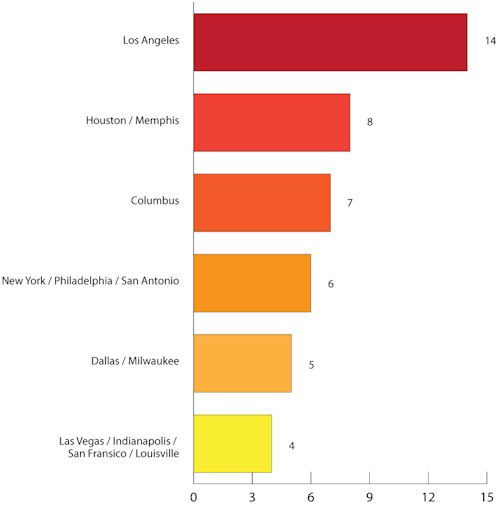
2023 Fatality Incidents by City
Los Angeles
Surges to Top Spot for First Time Since Tracking Began
| |
2023 Top Cities
1. Los Angeles, CA
2. Houston, TX / Memphis, TN
3. Columbus, OH
4. NYC / Philly / San Antonio
5. Dallas / Milwaukee
2022 Top Cities
1. Houston, TX
2. Memphis, TN
3. Chicago, IL
4. Philadelphia, PA
5. Atlanta, GA
2021 Top Cities
1. Houston, TX
2. Memphis, TN
3. Chicago, IL
4. Los Angeles & Las Vegas
5. Philadelphia, PA
2020 Top Cities
1. Philadelphia, PA
2. Chicago, IL
3. Houston, TX
4. Memphis, TN
5. Atlanta, GA
6. Cleveland, OH
2019 Top Cities
1. Houston, TX
2. Los Angeles, CA
2. Philadelphia, PA
2. Charlotte, NC
3. Chicago, IL
4. Cleveland, OH
4. Tulsa, OK
5. Las Vegas, NV
2018 Top Cities
1. Houston, TX
2. Las Vegas, NV
2. Birmingham, AL
3. Nashville, TN
3. New Orleans, LA
3. Jacksonville, FL
2017 Top Cities
1. Houston, TX
2. Memphis, TN
3. Atlanta, GA
4. Las Vegas, NV
5. Colorado Springs, CO
2016 Top Cities:
1. Houston, TX
2. Atlanta, GA
3. Detroit, MI
4. Phoenix, AZ
5. Chicago, IL
|
|
Methodology: The Daily collects this retail store specific information
from public news media sources throughout the United States and reports it daily
in our Retail Crime column. We do not survey any retailers or third parties nor
collect information from any retail executive. All of this information is
available through public news media outlets. We do not claim nor does it
represent all such incidents or deaths that may occur in retail locations or
retail corporate facilities as many may not be reported in the news media
depending on a number of variables outside of our control. We are not
responsible for the accuracy of the information reported in the various news
media outlets. We do not name any retailer, retail executive, suspect, or
victim.
Copyright: We reserve the rights to this industry exclusive
report and do not authorize its republication or reproduction without written
consent which may include a fee. By re-publishing or reproducing this report or
any parts of it without authorization the party agrees to pay a fee determined
by the D&D Daily.
 Share on Facebook
 Share on Twitter
 Share on LinkedIn
|
Click here to read all
of the Daily's exclusive retail crime reports
|
|