&uuid=(email))

The D&D Daily's Exclusive Q4 & 2022
Publicly Reported Retail Robbery & Burglary Report
Robberies Hit Highest Level in 6 Years
Robberies Up 18% From Previous Year - Highest Since 2016
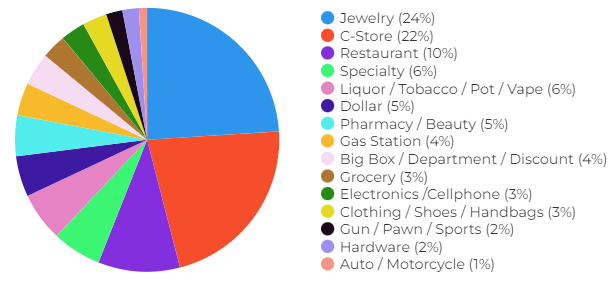
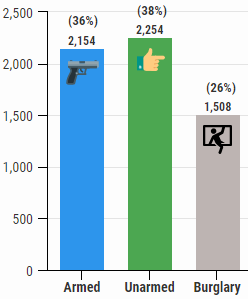
Jewelry Stores Top Retail Sector - Chicago Top City -
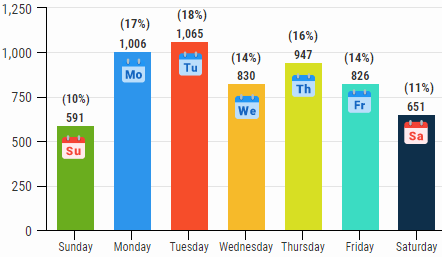
Tuesday Top Day

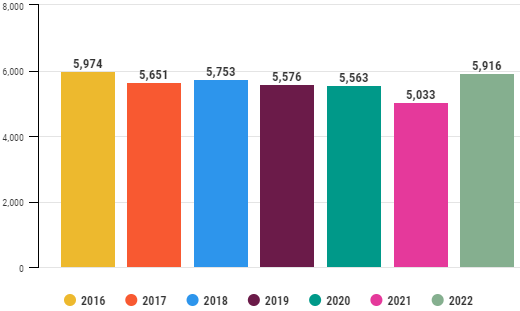
Yearly Comparison |
2016-2022
Up 18% From
2021 - Highest Total Since 2016
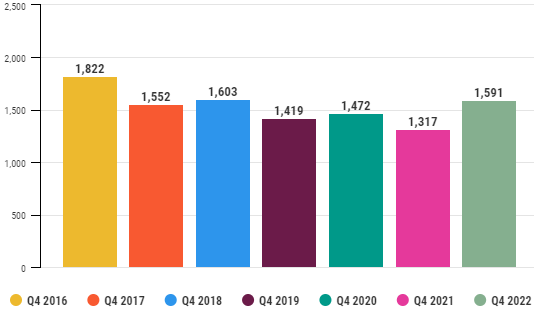
Q4 Comparison | 2016-2022
Up 21% From 2021 - Highest Since Q4 2018
Jewelry Takes #1 Spot for First Time Ever - Overtaking C-Stores
|
2022 Totals: |
2021 Totals: |
2020 Totals: |
|
|
|
|
|
|
|
|
Tuesday Overtakes Monday as Highest Day
*Not all incidents reported a weekday
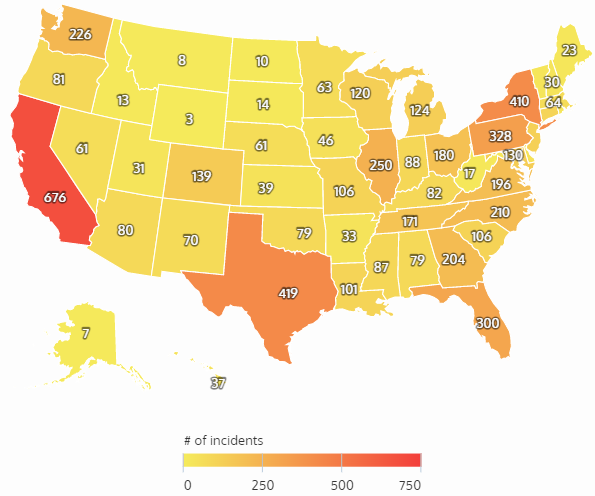
2022 Robberies by State California & Texas Top States 2016 to 2022
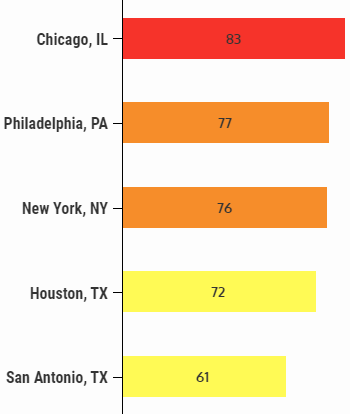
Chicago Top City for 3rd Straight Year
|
![]() Share on Facebook
Share on Facebook
![]() Share on Twitter
Share on Twitter
![]() Share on LinkedIn
Share on LinkedIn
|
|
Reporting Methodology:
The D&D Daily gathers retail-store specific information from public news media
sources throughout the United States and reports it daily through our
industry-renowned e-newsletter. We do not survey any retailers or third parties
nor collect information from any retail executives. All of this information is
available through public news media outlets. We do not claim nor does it
represent all such incidents or deaths that may occur in retail locations or
retail corporate facilities, as many may not be reported in the news media
depending on a number of variables outside of our control. We are not
responsible for the accuracy of the information reported in the various news
media outlets. We do not name any retailer, retail executive, suspect, or
victim.
Reposting/Sharing:
Portions of this report
or its findings may be reposted or shared with proper attribution to the D&D
Daily and a link back to this report page where possible.
Email our team to let us
know!
About The D&D Daily:
The D&D Daily is the #1
daily digital news source for the retail industry focused on retail trends, Loss
Prevention, Asset Protection and Cyber Security. Established in 2010, this
free daily e-newsletter is designed to deliver the information, news,
trends, retail crime data, technology developments, executive movement, and jobs
every day. Using a 2-minute drill type format, this '#1 copy-paste tool' allows
retail executives to see what’s important, relevant and critical, share it
throughout the organization quickly and easily, while saving the executives time
and providing them with the information they need to reduce shrink, increase
profitability and help make America’s retail stores safe. Visit
www.D-Ddaily.net and
sign up for your free email.