|

The D&D Daily's
Exclusive & Industry's Only
Q4 & 2022 Retail Violent Fatalities Report
2022 The Most Violent Year in America's Retail Stores Ever With 694 Fatalities
694 Fatalities Up 17% - 614 Incidents Up 17%
381 Customer Fatalities up 20%, 170 Associate Fatalities Up 10%
31 Police / Security / Loss Prevention Up 72%

|
Yearly Comparison
2016 - 2017 - 2018 - 2019 - 2020 - 2021 - 2022
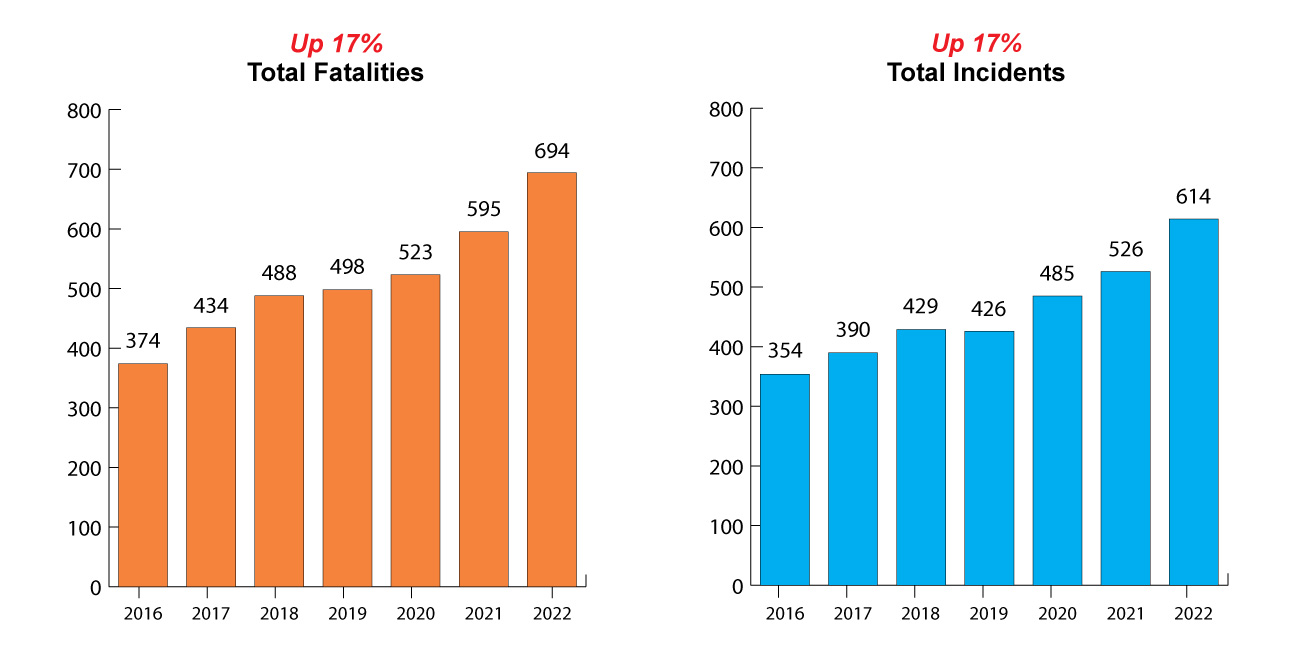
•
Fatalities up
86% from 2016 & 17% from 2021
•
Incidents up 73% from 2016 & 16% from
2021
|
|
Executive Summary
As violence has surged across America and across the globe, retailers from the UK, Canada and U.S. have reported a significant increase in aggressive behavior, employee abuse and assaults, shoplifter aggressiveness, workplace violence, active shooters, and even mass shootings.
From 2016 to 2019 we've seen a steady rise of violence in and around America's retail stores that resulted in fatalities. With the 2020 onset of the pandemic, the fatality numbers rapidly rose over 35% with 318 more fatalities than in 2019 and almost double from 2016, recording an 86% increase.
With 2022 proving to be the most violent year ever in America's retail stores with 694 violent fatalities, up 17% from 2021, 29% from 2020, and 35% from 2019. Certainly showing the impact of a number of variables.
Richard Berk, University of Pennsylvania, Department of Criminology, recently wrote:
The pandemic and the public health measures that followed no doubt disrupted day-to-day life and increased substantially life’s burdens, especially in disadvantaged neighborhoods. There is good reason to think that existing resentment increased, and new resentments were created. Surges in violent crime might follow. But the timing does not work unless one focuses only violent crime increases from the middle of 2020 perhaps through 2022.
Taking the raw numbers at face value, recent increases in homicides and violent crime have been attributed to three factors: (1) COVID-19 public health measures such as travel restrictions, school closures, lockdowns, and curfews, (2) COVID-19 sickness and death itself, and (3) less aggressive police practices in response on Black Lives Matter and other organized criticisms of police use of force. Upenn.edu
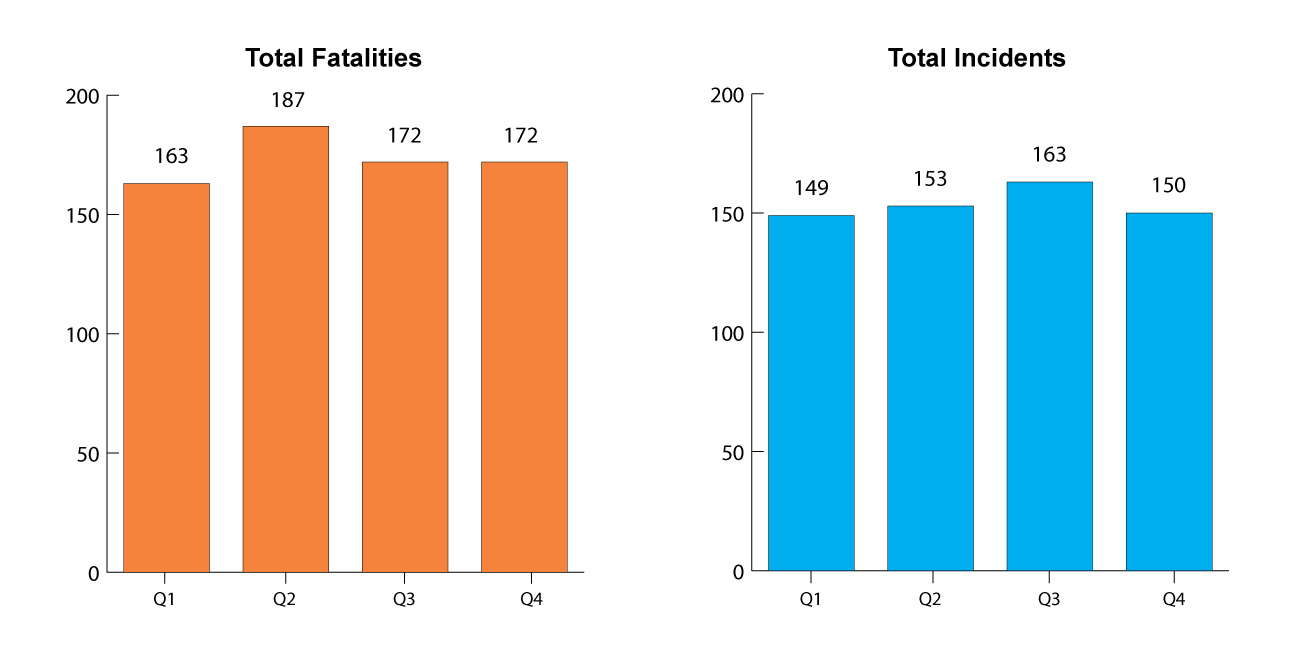
While fatalities and incidents remained relatively consistent throughout all four quarters of 2022 the number of customer fatalities, 381, continues to rise significantly, up 67% since 2019. Along with the number of associates, 170, rising 51% since 2019.
Parking lots continue to be the major area at 53% and increasing by 100 fatalities, and with in-store fatalities decreasing in percentage to 43%, but remaining at the same number of fatalities at 296, as in 2021. When it was the top location for fatalities.
One consistent remains that men with guns cause 83% to 94% of all fatalities in retail. With convenience stores 32%, restaurants 19%, gas stations 8%, Grocery 6%, and Malls 5% comprising 70% of all fatalities.
Monday, Sunday, and Thursday being the top three days of the week. With Friday's continuing to have the lowest fatalities throughout the seven years of reporting.
As usual, Texas, California, Georgia, and Florida being the top states six years running. And Houston being the deadliest city for six of the seven years of reporting. With Philadelphia holding that top rank only once in 2020.
Bottom line is that, the nation's violence has indeed spilled into America's stores. And while the industry continues to focus on shrinkage, organized retail theft, and cybersecurity, this writer would suggest more be done and budgeted to safeguard our customers and associates.
Certainly, the recent and somewhat surprising and rare reports of stores closings due to crime are regretful and not without negative reviews, the harsh reality is it may be serving the communities better and saving lives. The question is, what more can be done and are the nation's retailers willing to address the problem and find solutions. With 694 deaths in 2022 and over 3,606 in the last seven years, those victims deserve an answer. What are we doing, as an industry, to make our stores safer? by Gus Downing
|
|
4th Quarter Comparison
2016 - 2017 - 2018 - 2019 - 2020 - 2021 - 2022
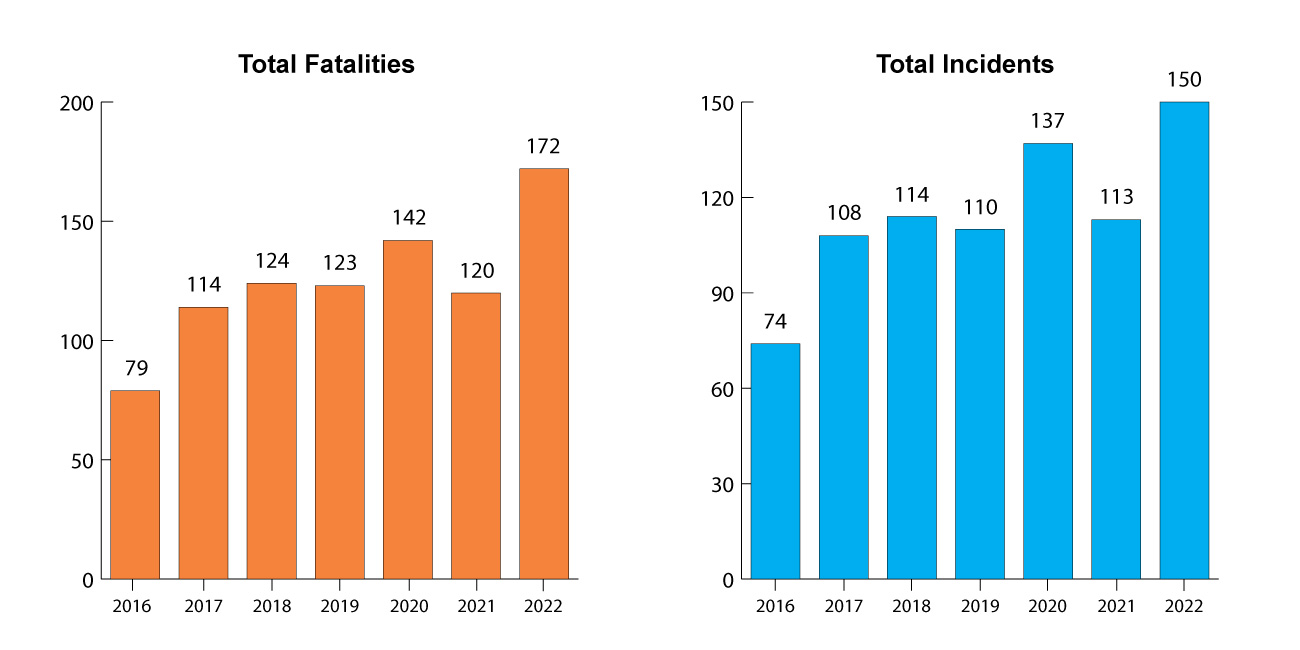
•
Fatalities up
118% from Q4 2016 & Up 43% from Q4 2021
•
Incidents up 103% from Q4 2016 &
Up 32%
from Q4 2021
|
|
2022 Incidents/ Fatalities by Quarter
|
2022's 694 Retail Violent Fatalities by Category
84% Victims - 16% Suspects
381/55%
Customers, 170/24% Associates,112/16% Suspects,
31/4% LP/LE/Security
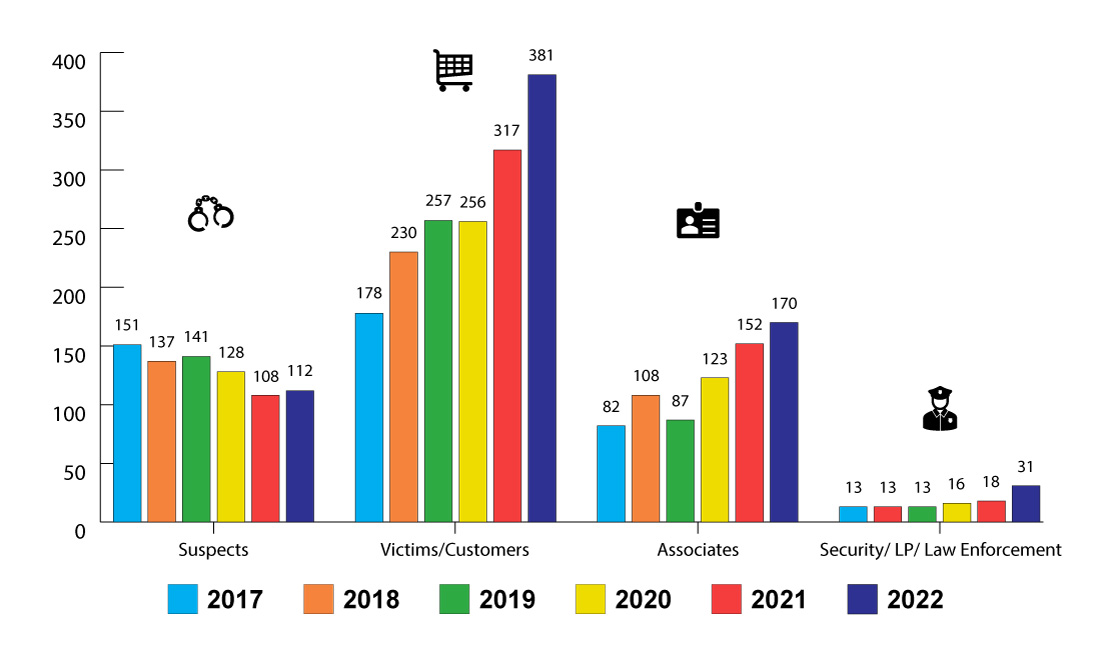
694 Total 2022 Fatalities
•
16%,
112 Suspects - Up 4% from '21
•
55%,
381 Customers - Up 18% from '21
•
24%, 170 Associates - Up 12% from '21
•
5%, 31 LE/LP/Security -
Up 72% from '21 |
|
595 Total 2021
Fatalities
•
18%,
108 Suspects - Down 16% from '20
•
53%,
317 Customers - Up 24% from '20
•
26%, 152 Associates - Up 24% from '20
•
3%, 18 LE/LP/Security -
Up 13% from '20 |
523 Total 2020
Fatalities
•
24%,
128 Suspects - Down 9% from '19
• 49%,
256 Customers - Flat from '19
•
24%, 123 Associates - Up 41% from '19
•
3%, 16 LE/LP/Security -
Up 23% from '19 |
|
498 Total 2019
Fatalities
•
28%,
141 Suspects - Up 3% from '18
•
52%,
257 Customers - Up 12% from '18
•
17%, 87 Associates - Down 19% from '18
•
3%, 13 LE/LP/Security - Same as '18 |
|
488 Total 2018 Fatalities
•
28%, 137 Suspects - Down 9% from '17
•
47%, 230 Customers - Up 29% from '17
•
22%, 108 Associates - Up 32% from '17
•
3%, 13 LE/LP/Security - Same as '17
|
|
424
Total 2017 Fatalities
• 36%,
151 Suspects
• 42%,
178 Customers
•
19%, 82 Associates
•
3%, 13 LE/LP/Security
|
|
|
2022's Fatalities
Location
53% Parking Lots,
43% In-Store, 3% Off Premises, 1% Malls
|
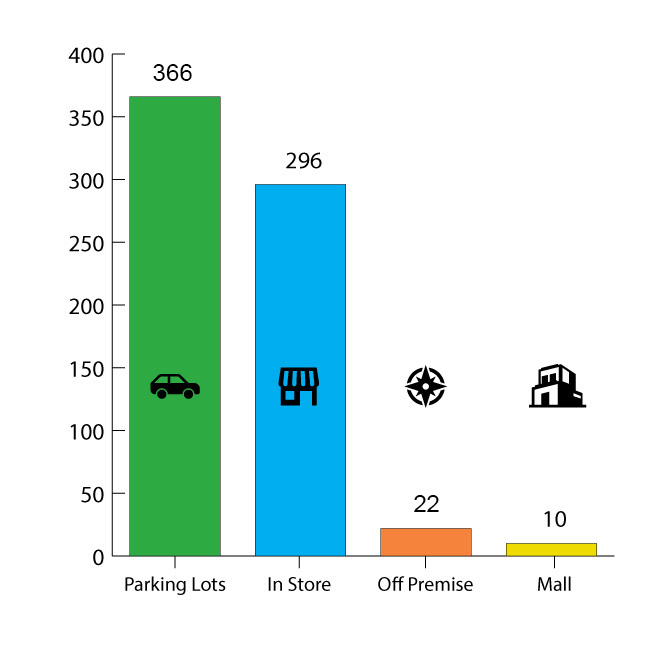 |
2022
Totals
•
53%,
366 killed in parking lots
•
43%, 296 in-store
•
3%, 22 died off
premises
•
1%, 10 mall
premises
2021
Totals
•
45%,
268 killed in parking lots
•
50%, 296 inside
store or mall
•
5%, 31 died off
premises
2020
Totals
•
48%,
251 killed in parking lots
•
47%, 247 inside store or mall
•
5%, 25 died off premises
2019
Totals
•
43%,
216 killed in parking lots
•
46%, 227 inside store or mall
•
11%, 55 died off premises
2018
Totals
•
51%,
250 killed in parking lots
•
35%,
172 inside store or mall
•
14%, 66 died off premises
2017 Totals
•
50%, 214 killed in parking lots
•
37%,
156 inside store or mall
•
13%, 54 died off premises
|
|
|
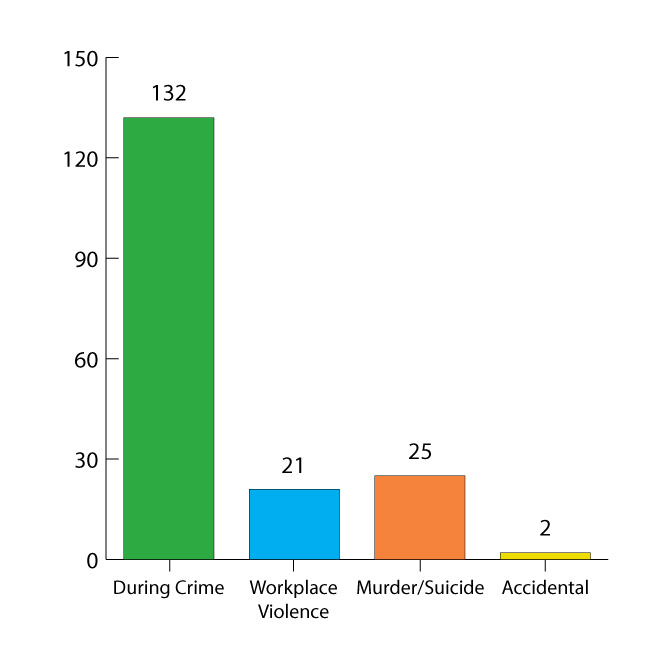
2022: 170 Associate Fatalities
78% Commission of Crime, 12% Workplace Violence
15% Murder/Suicide, 1% Accidental
|
|
2022 Totals
•
132 killed during robberies,
burglaries or thefts
•
21 killed in
argument/co-worker/workplace violence
•
25 killed in
murder/homicide/suicide
•
2 killed in accident
2021 Totals
•
93 killed during robberies,
burglaries or thefts
•
32 killed in
argument/co-worker/workplace violence
•
20 killed in
murder/homicide/suicide
•
7 killed in accident
2020 Totals
•
87 killed during robberies,
burglaries or thefts
•
23 killed in
argument/co-worker/workplace violence
•
7 killed in
murder/homicide/suicide
•
6 killed in accident
2019 Totals
•
54 killed during robberies,
burglaries or thefts
•
16 killed in
argument/co-worker/workplace violence
•
11 killed in
murder/homicide/suicide
•
6 killed in accident
2018 Totals
•
55 killed during robberies,
burglaries or thefts
•
19 killed in
argument/fight
•
20 killed in
murder/homicide/suicide
•
14 killed
by
former co-worker/relative/other
2017 Totals
• 58
killed during robberies, burglaries or thefts
•
10 killed in
argument/fight
•
8 killed by former
c-worker
•
5 killed by
relative/customer
•
1 killed in
murder/homicide
|
|
&uuid=(email))
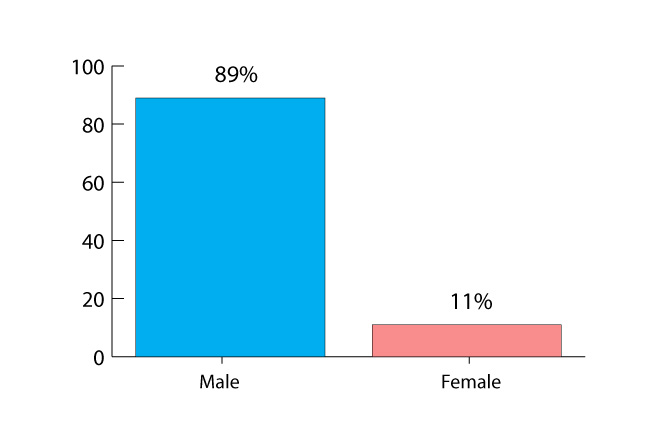
2022 Total Fatalities by Gender
89% Male - 11% Female
|
|
2022 Totals
•
89%,
140 Males
•
11%,
30 Females
2021 Totals
•
86%,
511 Males
•
14%,
84 Females
2020 Totals
•
85%,
447 Males
•
15%,
76 Females
2019 Totals
•
83%,
411 Males
•
15%,
76 Females
•
2%, 11 n/a
2018 Totals
•
77%,
377 Males
•
16%,
77 Females
•
7%,
34 n/a
2017 Totals
•
77%,
371 Males
•
16%,
42 Females
•
7%,
11 n/a
|
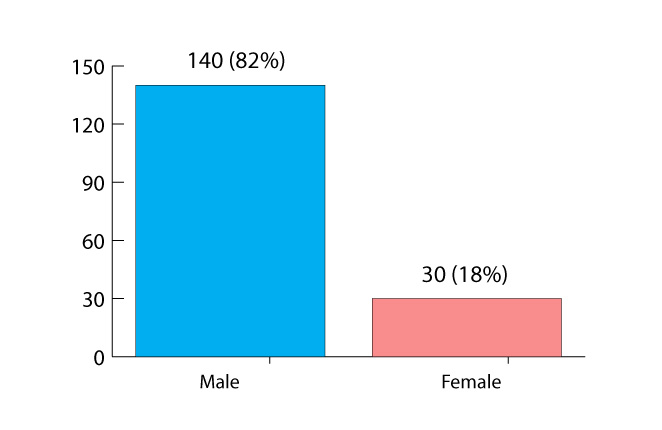
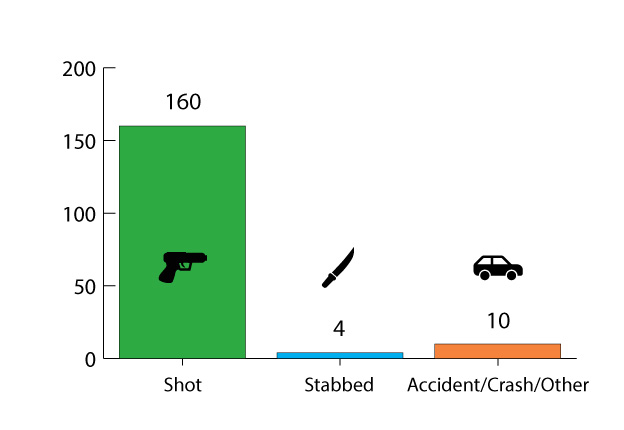
2022: 170 Associate Fatalities By Gender & Method
|
|
|
2022 Totals
•
82%,
140 Males
•
18%,
30 Females
2021 Totals
•
85%,
129 Males
•
15%,
23 Females
2020 Totals
•
88%,
108 Males
•
12%,
15 Females
2019 Totals
•
79%, 69 Males
•
20%,
17 Females
•
1%,
1 n/a
2018 Totals
•
69%,
74 Males
•
23%,
25 Females
•
8%,
9 n/a
2017 Totals
•
78%,
64 Males
•
18%,
15 Females
•
4%,
3 n/a
|
2022 Totals
•
94%, 160 shot
•
2%, 4 stabbed/beaten
•
6%, 10 accident/car crash/other
2021 Totals
•
93%, 142
shot
•
2%, 3 stabbed/beaten
•
5%, 7 accident/car crash/other
2020 Totals
•
88%, 109
shot
•
7%, 8 stabbed/beaten
•
5%, 6 car crash/other
2019 Totals
•
85%, 74
shot
•
10%, 8 stabbed
•
5%, 5 fire/accident/crash/other
2018 Totals
•
83%,
90 Killed by gun
•
12%, 13
stabbed/beaten
•
3%,
3
run over
•
2%, 2 medical reasons/other
2017 Totals
•
83%,
72 Killed by gun
•
12%, 7
stabbed/beaten
•
3%,
3
other
|
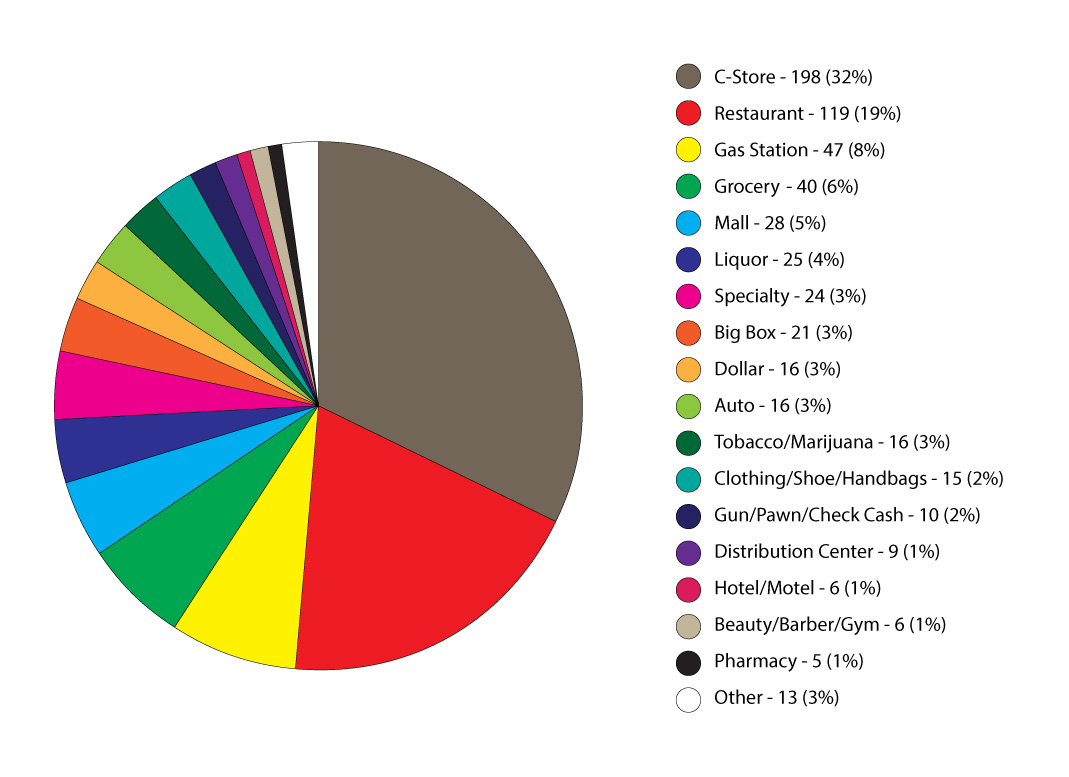
2022 Fatality Incidents by Store Type
C-Stores Top Store Type Six Straight Years
|
|
|
2022:
1. C-stores (32%)
2. Restaurants (19%)
3. Gas Station (8%)
4. Grocery (6%)
5. Mall (5%)
|
2021:
1.
C-stores (34%)
2. Restaurants (18%)
3. Grocery (8%)
4. Gas Station (7%)
5. Specialty (5%)
|
2020:
1.
C-stores (34%)
2. Restaurants (16%)
3. Gas Station (9%)
4. Mall (7%)
5. Grocery (7%)
|
|
|
2019:
1.
C-stores (26%)
2. Restaurants (16%)
3. Gas Station (9%)
4. Specialty (8%)
5. Big Box (8%)
|
2018:
1.
C-stores (21%)
2. Gas Stations (12%)
3. Other (11%)
4. Restaurant (10%)
5. Mall (9%)
|
2017:
1.
C-stores (18%)
2. Big Box (17%)
3. Gas Stations (12%)
4. Restaurants (9%)
5. Other (7%)
|
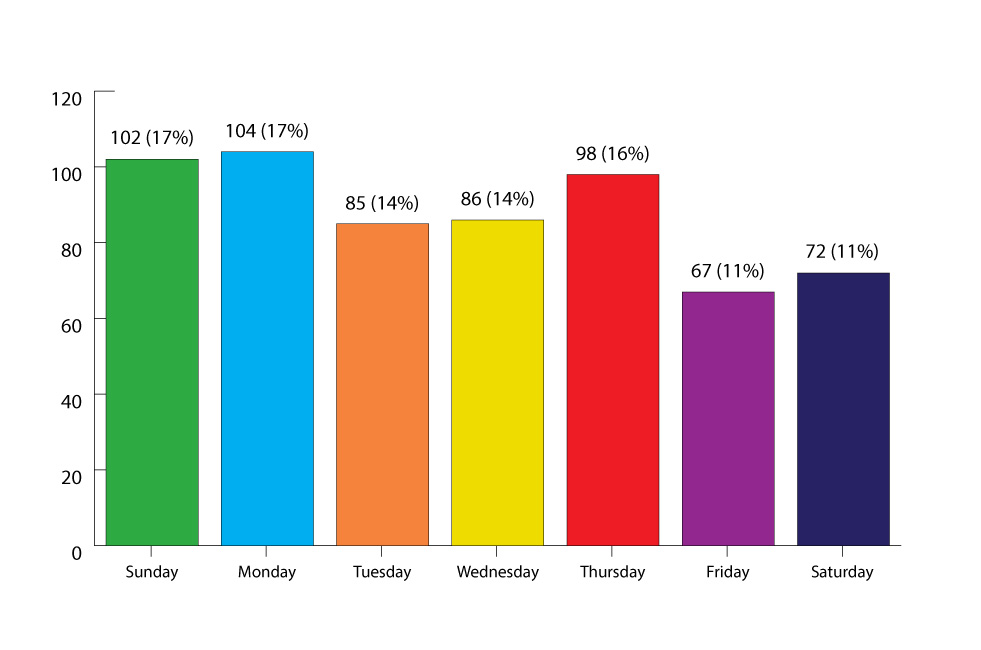
2022 Fatality Incidents by Weekday
Monday Highest for first time in 5 years – Friday Consistently Lowest
|
|
2022:
1. Monday - 104
2. Sunday - 102
3. Thursday - 98
4. Wednesday - 86
5. Tuesday - 85
6. Saturday - 72
7. Friday - 67
|
2021:
1. Tuesday - 90
2. Monday - 82
3. Saturday - 77
4. Sunday - 70
5. Wednesday - 70
6. Thursday - 70
7. Friday - 49
|
2020:
1. Tuesday - 84
2. Wednesday - 82
3. Monday - 77
4. Saturday - 72
5. Sunday - 66
6. Thursday - 55
7. Friday - 49
|
|
|
2019:
1. Tuesday - 78
2. Wednesday - 74
3. Thursday - 65
4. Monday - 63
5. Saturday - 63
6. Sunday - 60
7. Friday - 38
|
2018:
1. Saturday - 89
2. Wednesday - 79
3. Sunday - 77
4. Monday - 77
5. Tuesday - 70
6. Thursday - 57
7. Friday - 38
|
2017:
1. Monday - 71
2. Sunday - 63
3. Saturday - 62
4. Wednesday - 58
5. Tuesday - 56
6. Thursday - 49
7. Friday - 42
|
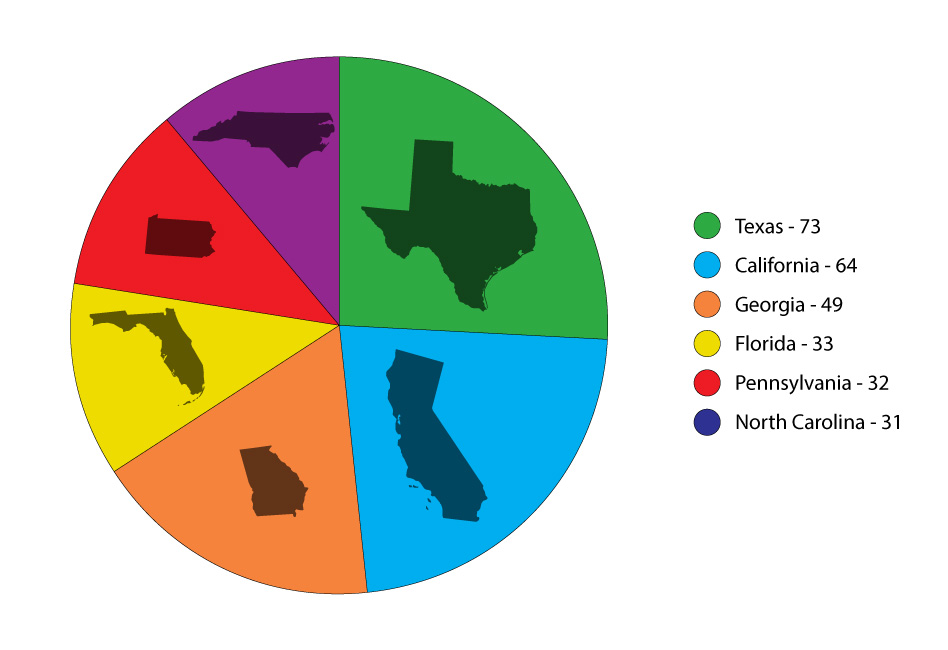
2022 Fatality Incidents by State
Texas & California Top
States for 7 Straight Years
2022:
1. Texas (73)
2. California (64)
3. Georgia (49)
4. Florida (33)
5. Pennsylvania (32)
|
2021:
1. Texas (66)
2. California (44)
3. Georgia (30)
4. Tennessee (26)
5. Florida & Pennsylvania (25)
|
2020:
1. California (65)
2. Texas (44)
3. Florida (36)
4. Georgia & NC (25)
5. Michigan (19)
|
2019:
1. California (46)
2. Texas (44)
3. Florida (31)
4. Georgia (27)
5. North Carolina (21)
|
2018:
1. Texas (54)
2. California (45)
3. Florida (33)
4. Georgia (24)
5. New York (18) |
2017:
1. Texas (52)
2. California (49)
3. Georgia (27)
4. Florida (25)
5. Tennessee (17) |
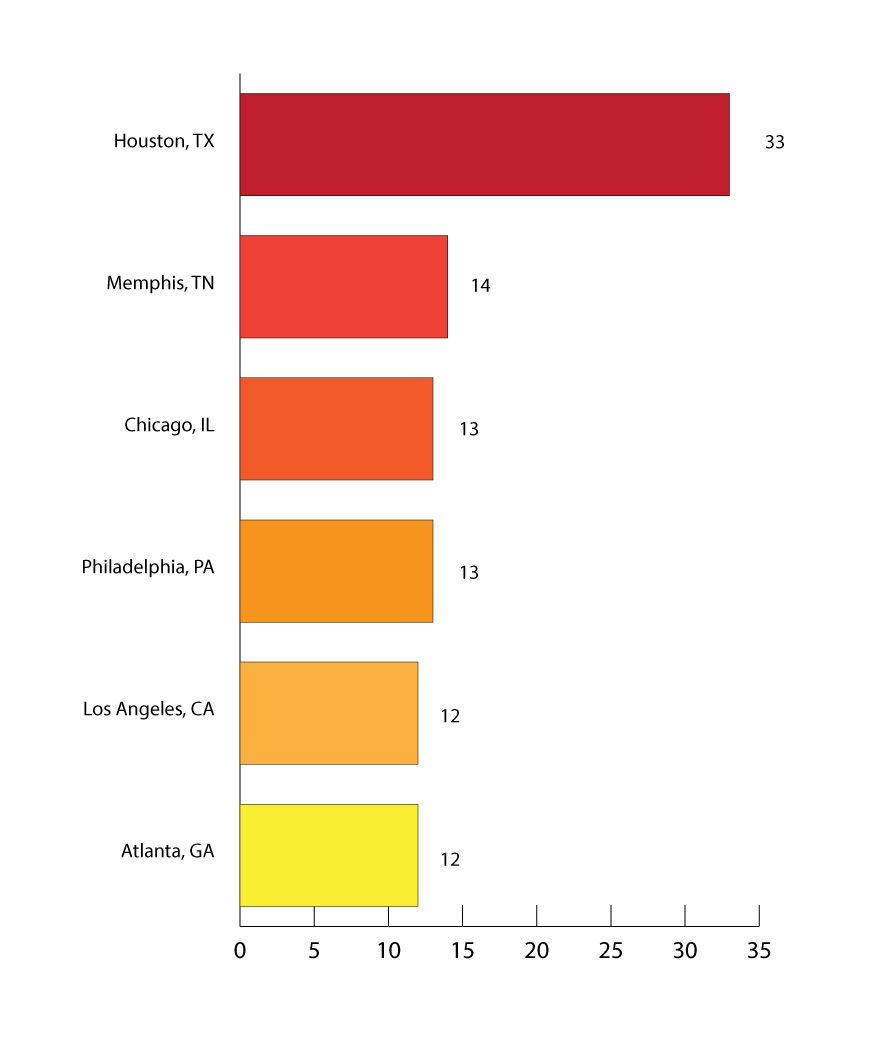
2022 Fatality Incidents by City
Houston Top
City Five Out of Seven Years
| |
2022 Top Cities
1. Houston, TX
2. Memphis, TN
3. Chicago, IL
4. Philadelphia, PA
5. Atlanta, GA
2021 Top Cities
1. Houston, TX
2. Memphis, TN
3. Chicago, IL
4. Los Angeles & Las Vegas
5. Philadelphia, PA
2020 Top Cities
1. Philadelphia, PA
2. Chicago, IL
3. Houston, TX
4. Memphis, TN
5. Atlanta, GA
6. Cleveland, OH
2019 Top Cities
1. Houston, TX
2. Los Angeles, CA
2. Philadelphia, PA
2. Charlotte, NC
3. Chicago, IL
4. Cleveland, OH
4. Tulsa, OK
5. Las Vegas, NV
2018 Top Cities
1. Houston, TX
2. Las Vegas, NV
2. Birmingham, AL
3. Nashville, TN
3. New Orleans, LA
3. Jacksonville, FL
2017 Top Cities
1. Houston, TX
2. Memphis, TN
3. Atlanta, GA
4. Las Vegas, NV
5. Colorado Springs, CO
2016 Top Cities:
1. Houston, TX
2. Atlanta, GA
3. Detroit, MI
4. Phoenix, AZ
5. Chicago, IL
|
|
Methodology: The Daily collects this retail store specific information
from public news media sources throughout the United States and reports it daily
in our Retail Crime column. We do not survey any retailers or third parties nor
collect information from any retail executive. All of this information is
available through public news media outlets. We do not claim nor does it
represent all such incidents or deaths that may occur in retail locations or
retail corporate facilities as many may not be reported in the news media
depending on a number of variables outside of our control. We are not
responsible for the accuracy of the information reported in the various news
media outlets. We do not name any retailer, retail executive, suspect, or
victim.
Copyright: We reserve the rights to this industry exclusive
report and do not authorize its republication or reproduction without written
consent which may include a fee. By re-publishing or reproducing this report or
any parts of it without authorization the party agrees to pay a fee determined
by the D&D Daily.
 Share on Facebook
 Share on Twitter
 Share on LinkedIn
|
Click here to read all
of the Daily's exclusive retail crime reports
|
&uuid=(email))
|