The D&D Daily's Exclusive Q4 & 2021
Publicly Reported Retail Robbery & Burglary Report
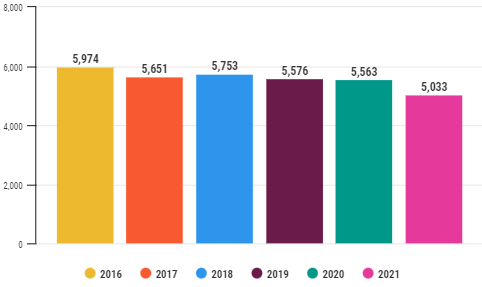
Robberies Hit New Yearly & Quarterly Lows
Robberies Down 9.5% From Previous Year - Down 16% From 2016
C-Stores Top Retail Sector - Chicago Top City -
Monday Top Day
Yearly Comparison -
2016-2021
Down 9.5% From
2020 - Lowest Year On Record
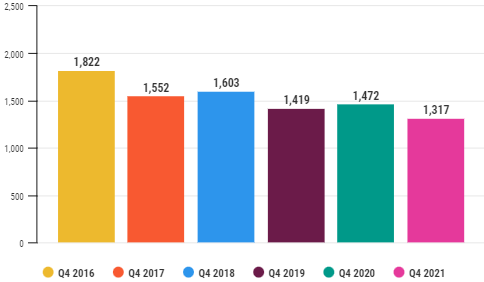
Q4 Comparison - 2016-2021
Down 10.5% From 2020 - Lowest Q4 On Record
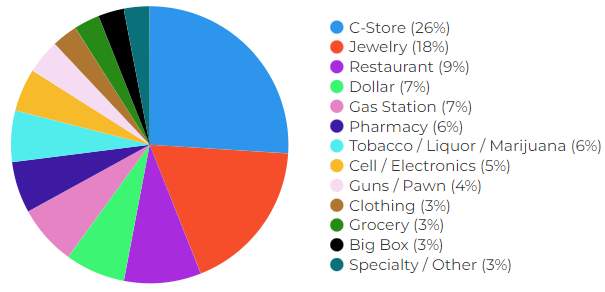
Robberies & Burglaries by Store Type
2021 Totals:
1. C-Store (26%)
2. Jewelry (18%)
3. Restaurant (9%)
4. Dollar & Gas (7%)
5. Pharmacy, Tobacco/Liq. (6%)
|
2020 Totals:
1. C-Store (25%)
2. Jewelry (14%)
3. Restaurant (11%)
4. Dollar, Gas, Pharm., Electronics (6%)
5. Liquor (5%)
|
2019
Totals:
1. C-Store (27%)
2. Restaurant (12%)
3.
Specialty/Other
(11%)
4. Jewelry (10%)
5. Dollar Store/Elect. (8%)
|
2018 Totals:
1. C-Store (31%)
2. Restaurant (10%)
3. Dollar Store (8%)
4. Cell/Elect. (8%)
5. Pharmacy (8%)
|
2017 Totals:
1. C-Store (48%)
2. Dollar Stores (17%)
3. Pharmacy (17%)
4. Cell/Elect. (8%)
5. Restaurants (6%)
|
*2016 Totals:
1. C-Stores/Gas
2. Pharmacy
3. Dollar Stores
4. Restaurants
5. Cell/Elect.
|
*2016 data did not include percentages
|
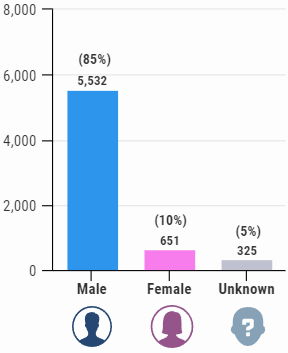
2021
Suspects by Gender
6,508
Total
Suspects
2021 Suspect Breakdown:
5,532 males (85%), 651 females (10%),
325 n/a (5%)
2020 Suspect Breakdown:
6,896 males (88%), 794 females (10%),
190 n/a (2%)
2019 Suspect Breakdown:
7,244 males (92%), 438 females (5%),
235 n/a (3%)
2018 Suspect Breakdown:
6,747 males (82%), 404 females (5%),
1,045 n/a (13%)
*2017 Suspect Breakdown:
4,505 males (86%), 238 females (5%),
486 n/a (9%)
*2017 started collecting data in Q2
|
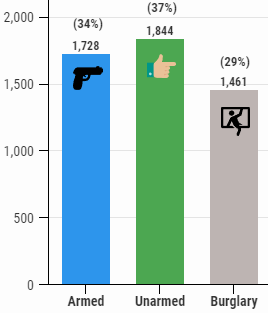
2021 Armed vs. Unarmed
2021 Breakdown:
1,728 armed (34%), 1,844 unarmed (37%),
1,461 burglaries (29%)
2020 Breakdown:
2,207 armed (40%), 1,926 unarmed (35%),
1,430 burglaries (25%)
2019 Breakdown:
2,835 armed (51%), 1,344 unarmed (24%),
1,397 burglaries (25%)
2018 Breakdown:
3,269 armed (57%), 2,484 unarmed (43%)
*2017 Breakdown:
2,348 armed (60%), 1,550 unarmed (39%),
34 n/a (1%)
*2017 started collecting data in Q2
|
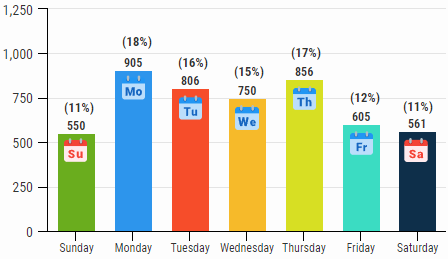
2021 Robberies by Weekday
Monday Highest Day 4 out of 5 Years
*Not all incidents reported a weekday
2021 Days
1. Mon. - 905
2. Thurs. - 856
3. Tues. - 806
4. Wed. - 750
5. Fri. - 605
6. Sat. - 561
7. Sun. - 550
|
2020 Days
1. Sun. - 952
2. Mon. - 940
3. Tues. - 855
4. Sat. - 736
5. Wed. - 733
6. Thurs. - 723
7. Fri. - 623
|
2019 Days
1. Mon. - 990
2. Wed. - 871
3. Tues. - 808
4. Sun. - 804
5. Sat. - 738
6. Thurs. - 691
7. Fri. - 653
|
2018 Days
1. Mon. - 926
2. Wed. - 852
3. Tues. - 830
4. Sun. - 799
5. Sat. - 696
6. Thurs. - 686
7. Fri. - 603 |
*2017 Days
1. Mon. - 538
2. Tues. - 519
3. Sun. - 517
4. Sat. - 481
5. Wed. - 462
6. Thurs. - 406
7. Fri. - 285
*2017 started collecting data
in Q2
|
|
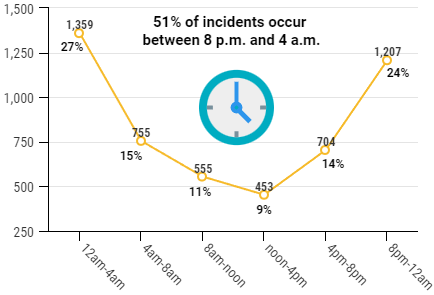
2021 Robberies by Time of Day
2021
Times
1. 12am - 4am: 1,359
2. 8pm - 12am: 1,207
3. 4am - 8am: 755
4. 4pm - 8pm: 704
5. 8am - 12pm: 555
6. 12pm - 4pm: 453
|
2020
Times
1. 8pm - 12am: 1,417
2. 12am - 4am: 1,342
3. 4pm - 8pm: 854
4. 4am - 8am: 792
5. 8am - 12pm: 590
6. 12pm - 4pm: 568
|
2019
Times
1. 12am - 4am: 1,432
2. 8pm - 12am: 1,342
3. 4am - 8am: 808
4. 4pm - 8pm: 743
5. 8am - 12pm: 538
6. 12pm - 4pm: 537
|
2018
Times
1. 8pm - 12am: 1,148
2. 12am - 4am: 1,097
3. 4pm - 8pm: 694
4. 4am - 8am: 687
5. 8am - 12pm: 500
6. 12pm - 4pm: 482
|
*2017 Times
1. 12am - 4am: 809
2. 8pm - 12am: 741
3. 4pm - 8pm: 431
4. 4am - 8am: 396
5. 8am - 12pm: 295
6. 12pm - 4pm: 294
*2017 started collecting data
in Q2
|
|
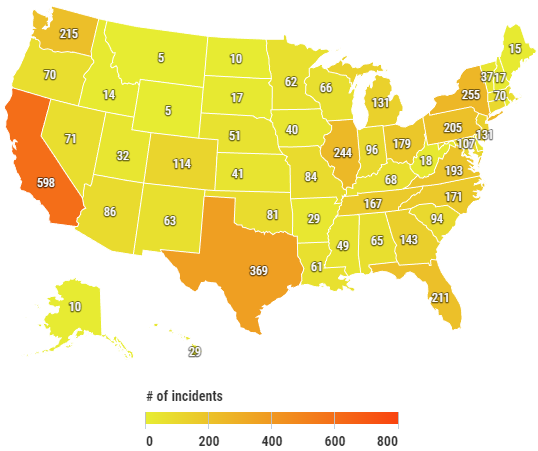
2021 Robberies by State
California & Texas Highest 2016 to 2021
2021:
1. Calif. (598)
2. Texas (369)
3. New York (255)
4. Illinois (244)
5. Washington (215) |
2020:
1. Calif. (528)
2. Texas (424)
3. New York (347)
4. Illinois (286)
5. FL (280)
|
2019:
1. Calif. (604)
2. Texas (451)
3. FL (278)
4. Ohio (265)
5. PA (235)
|
2017:
1. Calif. (506)
2. Texas (362)
3. FL (333)
4. Ohio (307)
5. PA (133)
|
2018:
1. Calif. (570)
2. Texas (446)
3. Ohio (291)
4. FL (283)
5. PA (263)
|
2016:
1. Texas (485)
2. Calif. (419)
3. FL (353)
4. Ohio
5. PA
|
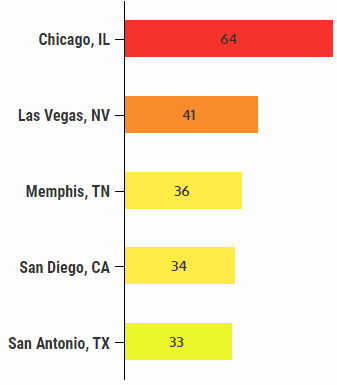
2021 Robberies by
City
Chicago Top City
for 2nd Straight Year
2021 Cities
1. Chicago, IL: 64
2. Las Vegas, NV: 41
3. Memphis, TN: 36
4. San Diego, CA: 34
5. San Antonio, TX: 33
2020 Cities
1. Chicago, IL: 87
2. San Antonio, TX: 72
3. New York, NY: 53
4. Portland, OR: 44
5. Las Vegas, NV: 32
2019 Cities
1. Houston, TX: 67
2.
San Antonio,
TX: 57
3. Las Vegas, NV: 47
4. Chicago, IL: 45
5. Charlotte, NC: 44
2018 Cities
1. Tulsa, OK: 81
2.
Houston, TX:
79
3. Madison, WI: 36
4. Charlotte, NC: 34
5. New Orleans, LA: 30
2017
Cities
1. Houston, TX
2. Tulsa, OK
3. Colorado Springs, CO
4. Nashville, TN
5. Chicago, IL
2016 Cities
1. Houston, TX
2. Memphis, TN
3. Dayton, OH
4. Tulsa, OK
5. Cleveland, OH
*Began
logging complete Top 5 city & state
data in 2017 |
|
|
|
Share on Facebook
Share on Twitter
Share on LinkedIn
Click here to read all
of the Daily's exclusive retail crime reports
|
Reporting Methodology:
The D&D Daily gathers retail-store specific information from public news media
sources throughout the United States and reports it daily through our
industry-renowned e-newsletter. We do not survey any retailers or third parties
nor collect information from any retail executives. All of this information is
available through public news media outlets. We do not claim nor does it
represent all such incidents or deaths that may occur in retail locations or
retail corporate facilities, as many may not be reported in the news media
depending on a number of variables outside of our control. We are not
responsible for the accuracy of the information reported in the various news
media outlets. We do not name any retailer, retail executive, suspect, or
victim.
Reposting/Sharing:
Portions of this report
or its findings may be reposted or shared with proper attribution to the D&D
Daily and a link back to this report page where possible.
Email our team to let us
know!
About The D&D Daily:
The D&D Daily is the #1
daily digital news source for the retail industry focused on retail trends, Loss
Prevention, Asset Protection and Cyber Security. Established in 2010, this
free daily e-newsletter is designed to deliver the information, news,
trends, retail crime data, technology developments, executive movement, and jobs
every day. Using a 2-minute drill type format, this '#1 copy-paste tool' allows
retail executives to see what’s important, relevant and critical, share it
throughout the organization quickly and easily, while saving the executives time
and providing them with the information they need to reduce shrink, increase
profitability and help make America’s retail stores safe. Visit
www.D-Ddaily.net and
sign up for your free email.
|