|

The D&D Daily's
Exclusive - Publicly Reported
Q1 2021 Retail Violent Fatalities Report
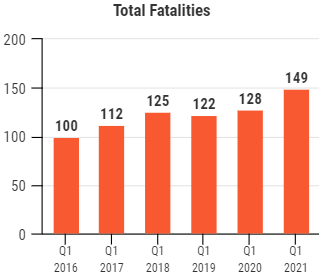
149 Total
Fatalities - Up 49% Over 2016, Up 16% Over 2020
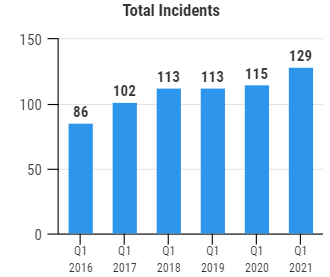
Most Q1 Incidents & Fatalities Ever Recorded
Customer Fatalities Nearly Double
Highest Victim Deaths Ever - Lowest Suspect Deaths Ever
1st Quarter Comparison
2016 -
2017 - 2018 - 2019 - 2020 - 2021
|
Up 49%
|
Up 50%
|
|
•
149 Fatalities – Up 49% Over 2016, Up
16% Over 2020
•
129 Incidents – Up
50% Over 2016, Up 12% Over 2020
•
Most Q1 Fatalities & Incidents Ever Recorded |
|
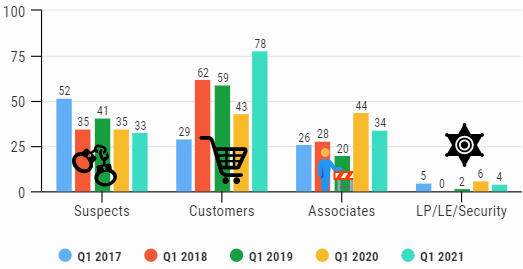
Q1 2021's 149 Retail Violent Fatalities by Category
78% Victims - 22% Suspects
34/23%
Associates - 78/52% Customers - 4/3% LP/LE/Security
33/22% Suspects
| |
149
Total Q1 2021 Violent Deaths
• 22%,
33 Suspects - down 6% from '20
•
52%,
78 Customers - up 81% from '20
• 23%,
34 Associates - down 23% from '20
•
3%, 4
LE/LP/Security - down 33% from '20 |
128
Total Q1 2020 Violent Deaths
• 27%,
35 Suspects - down 15% from '19
•
34%,
43 Customers - down 27% from '19
•
34%, 44 Associates - up 120% from '19
•
5%, 6
LE/LP/Security - up 200% from '19 |
| |
122
Total Q1 2019 Violent Deaths
•
34%,
41 Suspects - up 17% from '18
• 48%,
59 Customers - down 5% from '18
•
16%, 20 Associates - down 28% from '18
•
2%, 2
LE/LP/Security |
125
Total Q1
2018 Violent Deaths
•
28%,
35 Suspects - down 32% from '17
• 50%,
62 Customers - up 114% from '17
•
22%, 28 Associates - up 8% from '17
•
0%, 0 LE/LP/Security
|
| |
112
Total Q1
2017 Violent Deaths
• 46%,
52 Suspects
• 26%,
29 Customers
•
23%, 26 Associates
•
4%, 5
LE/LP/Security
|
|
|
|
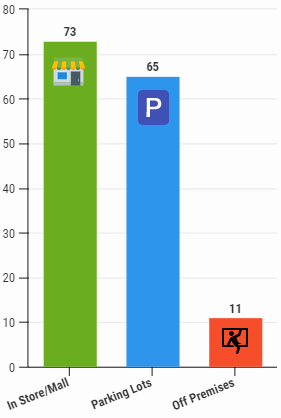
Q1 2021 Fatalities
Location
49% In-Store, 44% Parking Lots,
7% Off Premises
|
|
Q1
2021
Totals
•
44%,
65 killed in parking lots
•
49%, 73 inside store or mall
•
7%, 11 died off premises
Q1
2020
Totals
•
27%,
35 killed in parking lots
•
64%, 82 inside store or mall
•
9%, 11 died off premises
Q1 2019
Totals
•
45%,
54 killed in parking lots
•
37%, 46 inside store or mall
•
18%, 22 died off premises
Q1 2018 Totals
•
51%, 64 killed in parking lots
•
35%, 44 inside store or mall
•
14%, 17 died off premises
Q1
2017 Totals
•
57%, 64
killed in parking lots
•
37%, 41 inside store or mall
•
6%, 7 died off premises
|
|
|
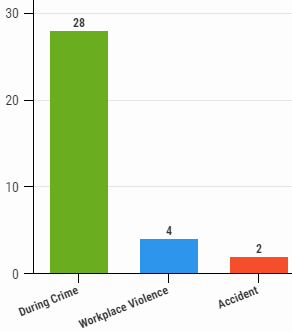
Q1 2021: 34 Associate Fatalities
82% Commission of Crime, 12% Workplace Violence
6% Accidental
|
|
Q1 2021 Totals
• 28 killed during robberies,
burglaries or thefts
• 4 killed in workplace
violence incidents
•
2
killed in accidents
Q1 2020 Totals
• 33 killed during robberies,
burglaries or thefts
• 8 killed in workplace
violence incidents
•
2
killed in accidents
•
1 killed
in suicide
Q1 2019 Totals
• 11 killed during robberies,
burglaries or thefts
•
5 killed in
murder/homicide/suicide
• 3 killed in workplace
violence/co-worker
•
1 killed
in crash
Q1
2018 Totals
• 11 killed during robberies,
burglaries or thefts
•
11 killed in
murder/homicide/suicide
•
4 killed in workplace violence
•
1 killed in accident
•
1 killed
by
former co-worker/relative/other
Q1
2017 Totals
• 24
killed during robberies, burglaries or thefts
•
1 killed by former
co-worker
•
1 killed by
relative/customer
|
|
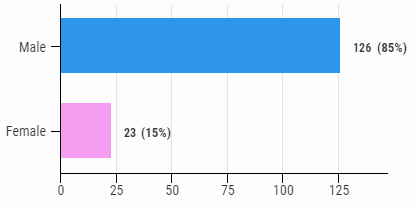
Q1 2021 Total Fatalities by Gender
85% Male - 15% Female
|
Q1 2021 Totals
•
85%, 126 Males
•
15%,
23 Females
Q1 2020 Totals
•
87%, 111 Males
•
13%, 17 Females
Q1 2019 Totals
•
81%, 99 Males
•
11%, 14 Females
•
7%, 9 n/a
Q1 2018 Totals
•
77%,
96 Males
•
18%,
23 Females
•
5%,
6 n/a
Q1 2017 Totals
•
89%, 100 Males
•
9%,
10 Females
•
3%, 4 n/a
|
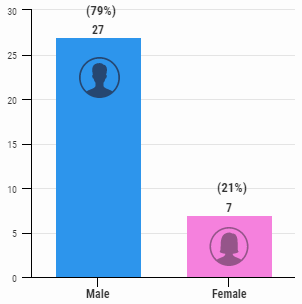
Q1 2021 34 Associate Fatalities By Gender & Method
|
 |
|
Q1
2021 Totals
•
79%,
27 Males
•
21%,
7 Females
Q1
2020 Totals
•
91%,
40 Males
•
9%,
4 Females
Q1
2019 Totals
•
70%,
14 Males
•
25%,
5 Females
•
5%,
1 n/a
Q1
2018 Totals
•
57%,
16 Males
•
36%,
10 Females
•
7%,
2 n/a
Q1
2017 Totals
•
73%,
19 Males
•
27%,
7 Females
|
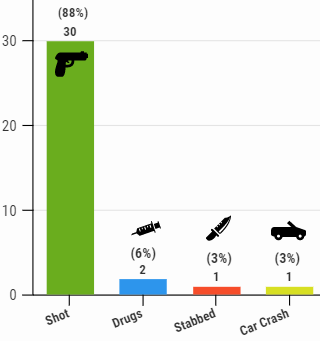
Q1 2021 Totals
•
88%,
30 Killed by gun
•
6%, 2 from drugs
•
3%, 1 stabbing
•
3%, 1 car crash
Q1 2020 Totals
•
89%,
39 Killed by gun
•
7%, 3
stabbed
•
4%, 2 accidental car crash
Q1 2019 Totals
•
95%,
19 Killed by gun
•
5%, 1 car crash
Q1 2018 Totals
•
86%,
24 Killed by gun
•
11%, 3
stabbed/beaten
•
3%,
1
run over
Q1 2017 Totals
•
77%,
20 Killed by gun
•
19%, 5
stabbed/beaten
•
4%,
1 fire
|

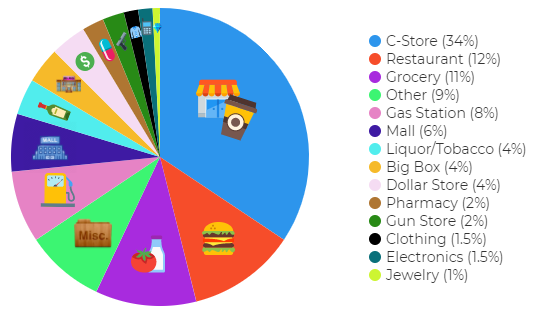
Q1 2021
Fatality Incidents by Store Type
C-Stores Top Store Type Six Straight Years
|
Q1 2021 Totals:
1.
C-stores (34%)
2. Restaurants (12%)
3. Grocery (11%)
4. Other (9%)
5. Gas Station (8%)
|
Q1 2020 Totals:
1.
C-stores (33%)
2. Restaurants (20%)
3. Liquor/Tobacco (9%)
4. Other (9%)
5. Big Box & Mall (7%)
|
Q1 2019 Totals:
1.
C-stores (20%)
2. Gas Stations (11%)
3. Grocery (10%)
4. Restaurants (9%)
5. Specialty (9%)
|
Q1 2018
Totals:
1.
C-stores (19%)
2. Other (13.6%)
3. Gas Stations (12.8)
4. Malls/Shopping Centers (9.6%)
5. Restaurants (8.8%)
|
Q1 2017
Totals:
1.
C-stores (28%)
2. Restaurants (15%)
3. Big Box (14%)
4. Other (9%)
5. Grocery Stores (5%)
|
2016
Totals:
1.
C-stores (26%)
2. Gas Stations (25%)
3. Big Box (21%)
4. Restaurants (9%)
5. Dollar Stores (8%)
|
|
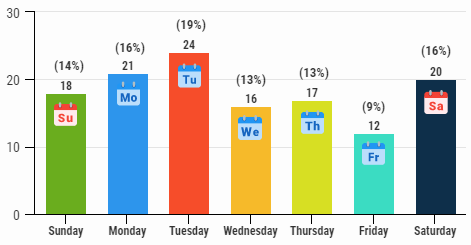
Q1 2021 Fatality Incidents
by Weekday
Tuesday Highest - Two Out of Last Three Years
|
|
Q1 2021
Days Ranked:
1. Tuesday - 24
2. Monday - 21
3. Saturday - 20
4. Sunday - 18
5. Thursday - 17
6. Wednesday - 16
7. Friday - 12
|
Q1 2020
Days Ranked:
1. Wednesday - 22
2. Tuesday - 21
3. Saturday - 19
4. Friday - 15
5. Thursday - 14
6. Sunday - 12
6. Monday - 12
|
Q1 2019
Days Ranked:
1. Tuesday - 28
2. Wednesday - 23
3. Thursday - 20
4. Saturday - 17
5. Sunday - 13
6. Friday - 12
7. Monday - 9
|
Q1 2018
Days Ranked:
1. Wednesday - 31
2. Sunday - 19
3. Monday - 19
4. Tuesday - 17
5. Thursday - 16
6. Saturday - 16
7. Friday - 7
|
Q1 2017
Days Ranked:
1. Saturday - 19
2. Monday - 19
3. Sunday - 18
4. Tuesday - 17
5. Wednesday - 16
6. Thursday - 14
7. Friday - 7
|
2016
Days Ranked:
1. Sunday
2. Friday
3. Saturday
4. Wednesday
5. Monday
6. Tuesday
7. Thursday
|
|
Five Year Day-of-Week
Pattern
1. Wednesday – 108
2. Tuesday – 107
3. Saturday – 91
4. Thursday – 81
5. Monday – 80
6. Sunday – 80
7. Friday – 53 |
*Complete data not available
for 2016
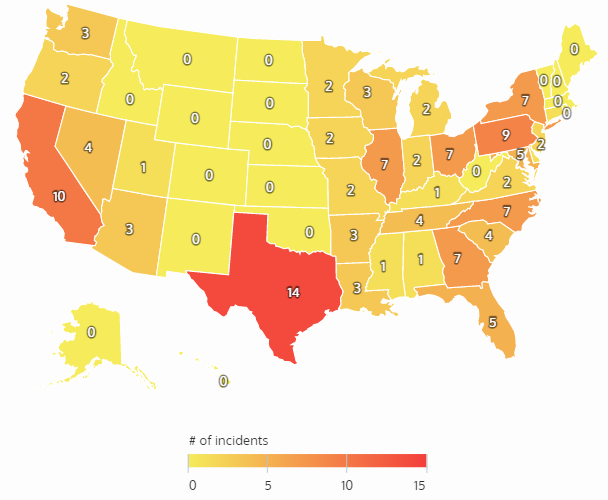
Q1 2021 Fatality Incidents by State
Texas Top State - 5 Out
of Last 6 Years
|
Q1 2021 Top States
1. Texas (14)
2. California (10)
3. Pennsylvania (9)
4. GA, IL, NC, NY & OH (7)
5. Florida & Maryland (5)
|
Q1 2020 Top States
1. California (17)
2. Texas (9)
3. Georgia (8)
4. Florida & N. Carolina (7)
5. Ohio (6)
|
Q1 2019 Top States
1. Texas (15)
2. California (11)
3. Florida (8)
4. Virginia (7)
5. North Carolina (6)
|
|
Q1
2018 Top States
1. Texas (17)
2. California (16)
3. North Carolina (8)
4. Florida (7)
5. GA, AL & AZ (6)
|
Q1 2017 States Ranked
1. Texas (15)
2. California (12)
3. Georgia (9)
4. FL & NC (7 each)
5. AR & TN (5 each)
|
2016 States
Ranked
1. Texas (43)
2. California (39)
3. Florida (31)
4. Georgia (23)
5. Ohio (17)
|
Q1 2021 Fatality Incidents by City
Baltimore Becomes Top City
Q1 2021 Top Cities
1. Baltimore, MD
2. Chicago, IL
3. Las Vegas, NV
4. Little Rock, AR
5. Memphis, TN |
Q1 2020 Top Cities
1. Houston, TX
2. Chicago, IL
2. Cleveland, OH
2. Philadelphia, PA
3. Los Angeles, CA |
Q1 2019 Top Cities
1. Ft. Worth, TX
2. Charlotte, NC
3. DeKalb, GA
3. Philadelphia, PA
3. Wayne, NJ |
Q1
2018 Top Cities
1. Birmingham, AL
2. Houston, TX
3. Melcroft, NC
4. Las Vegas, NV
5. Jacksonville, FL |
Q1
2017 Top Cities
1. Houston, TX
2. Memphis, TN
3. Little Rock, AR
4. Indianapolis, IN
5. Atlanta, GA |
2016 Top Cities
1. Houston, TX
2. Atlanta, GA
3. Detroit, MI
4. Phoenix, AZ
5. Chicago, IL |
Methodology: The Daily collects this retail store specific information
from public news media sources throughout the United States and reports it daily
in our Retail Crime column. We do not survey any retailers or third parties nor
collect information from any retail executive. All of this information is
available through public news media outlets. We do not claim nor does it
represent all such incidents or deaths that may occur in retail locations or
retail corporate facilities as many may not be reported in the news media
depending on a number of variables outside of our control. We are not
responsible for the accuracy of the information reported in the various news
media outlets. We do not name any retailer, retail executive, suspect, or
victim.
Copyright: We reserve the rights to this industry exclusive
report and do not authorize its republication or reproduction without written
consent which may include a fee. By re-publishing or reproducing this report or
any parts of it without authorization the party agrees to pay a fee determined
by the D&D Daily.
 Share on Facebook
 Share on Twitter
 Share on LinkedIn
|
Click here to read all
of the Daily's exclusive retail crime reports
|

|