Click here to view the web version of this report
&uuid=(email))

The D&D Daily's Publicly Reported
& Industry's Only
Q4 & 2020 Organized Retail Crime Report
COVID Drives ORC Cases & Suspects
Down - But Dollar Amount Spikes
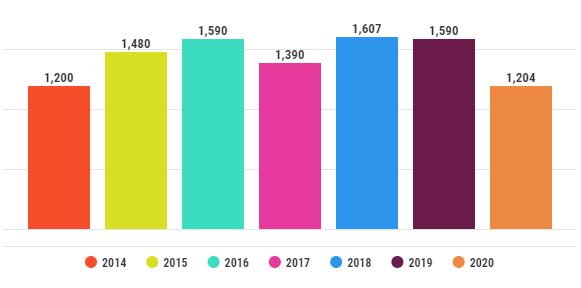
ORC Cases Down 24%
in 2020 - Lowest Since 2014
Dollar Amount
Highest Ever Recorded - Up 71% Since '19

Yearly
ORC Case Comparison - Down 24% From '19
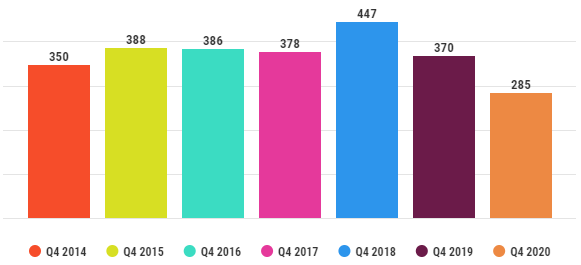
Q4 ORC Case Comparison - Down 23% From '19
| Year | $ Amount Reported | $ Average Per Case |
| 2014 | $681,802,614 | $194,002 |
| 2015 | $515,088,741 | $112,222 |
| 2016 | $514,285,830 | $71,877 |
| 2017 | $389,445,396 | $97,658 |
| 2018 | $165,493,452 | $102,982 |
| 2019 | $248,763,877 | $141,360 |
| 2020 | $291,495,187 | $242,106 |
•
Average case value up 71% since 2019 - highest recorded over 7 years
•
Average case values: Ranged from
a low of $71,877 to a high of $242,106.
•
2016 to present represents post-EMV
Special note: 2014 and 2015 amounts reflect the pre-EMV roll-out and a
larger amount of big counterfeit credit card cases.
The following high-dollar counterfeit credit card cases were excluded in the
average calculations:
•
Two $200M cc fraud cases on
May 14 &
June 20, 2014
•
One $325M counterfeit case on
Jan. 16, 2015
•
Two $200M cc fraud cases on
Jan. 8 &
May 9, 2016
•
One $170M cc fraud case on
April 19, 2017
•
One $51M cc fraud case on
May 23, 2018
• One $30M cc fraud case
on
Sept. 26, 2014
• One $24M cc/gift card fraud case
on
July 11, 2019
|
2020 ORC Cases by Type 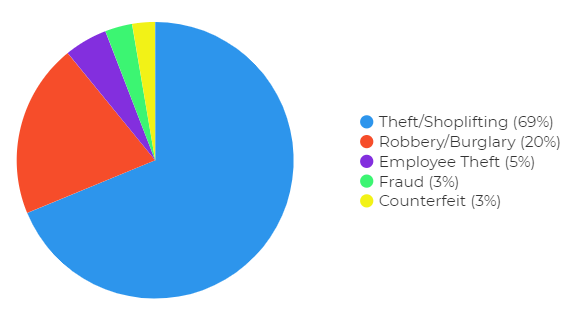 |
|
2020 Cases: 1. Theft/Shoplift - 69% 2. Robbery/Burg. - 20% 3. Emp. Theft - 5% |
2019 Cases: 1. Theft/Shoplift - 70.5% 2. Robbery/Burg. - 13.5% 3. Emp. Theft - 6% |
2018
Cases: 1. Theft/Shoplift - 66% 2. Robbery/Burg. - 12% 3. Emp. Theft - 8% |
|
2017
Cases: 1. Theft/Shoplift - 67% 2. Robbery/Burg. - 11% 3. Emp. Theft - 6% |
2016
Cases: 1. Theft/Shoplift - 67% 2. Other - 11% 3. CC Fraud - 8% |

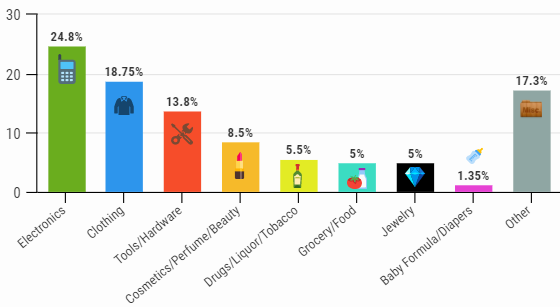
2020 ORC Cases by Merchandise Stolen
|
2020 • Electronics (24.8%) • Clothing (18.75%) • Tools (13.8%) |
2019 • Clothing (23%) • Electronics (22%) • Tools (12%) |
2018 1. Clothing (30%) 2. Electronics (27%) 3. Tools (14%) |
2017* 1. Electronics (30%) 2. Clothing (16%) 3. Jewelry (15%) |
*Quarterly breakdown not available for 2017 **Other includes Sporting Goods, Housewares, Gift cards, Specialty |
|||
2020 ORC Suspect Comparison
| Year | Suspects | Male | Female | Unreported | % Male | % Female |
| 2014 | 3,235 | 1,764 | 1,048 | 423 | 63% | 37% |
| 2015 | 3,528 | 1,843 | 1,097 | 588 | 63% | 37% |
| 2016 | 3,682 | 1,687 | 1,006 | 989 | 63% | 37% |
| 2017 | 3,225 | 1,319 | 901 | 1,005 | 59% | 41% |
| 2018 | 3,420 | 1,701 | 1,142 | 577 | 60% | 40% |
| 2019 | 3,710 | 2,018 | 1,188 | 504 | 63% | 37% |
| 2020 | 2,810 | 1,895 | 906 | 9 | 68% | 32% |
Fewest suspects recorded in publicly reported data.
2020 ORC Cases by State & City
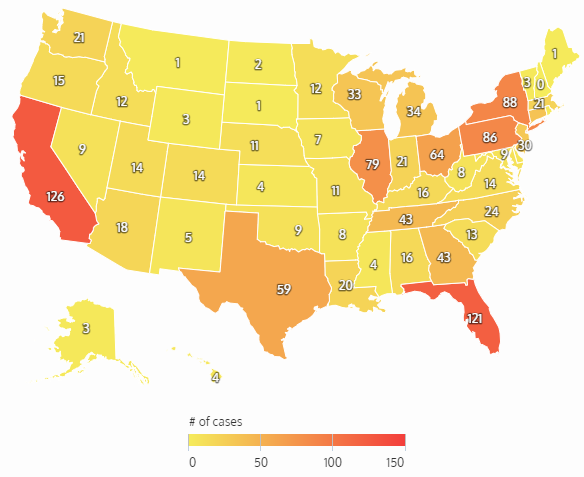
|
Top States - 2020 1. California (126) 2. Florida (121) 3. New York (88) 4. Pennsylvania (86) 5. Illinois (79) |
Top States - 2019 1. California (189) 2. Florida (145) 3. Pennsylvania (109) 4. Texas (91) 5. Illinois (90) |
|
Top States - 2018 1. California (161) 2. Florida (142) 3. Pennsylvania (116) 4. Illinois (100) 5. Texas (78) |
Top States - 2017 1. California (88) 2. Florida (82) 3. Pennsylvania (68) 4. Texas (59) 5. Illinois (54) |
|
|
|
|
Top Cities - 2020 • New York City (24) • Chicago, IL (10) • Coral Springs, FL (9) • Jacksonville, FL & Madison, WI (8) • Lexington, KY & Miami, FL (7) |
Top Cities - 2019 • Millburn, NJ (20) • Chicago, IL (17) • Laredo, TX (12) • Houston, TX (11) • Miami, FL & Fresno, CA (10) |
|
Top
Cities - 2018 1. Memphis, TN & Tallahassee, FL (14) 2. Detroit, MI & Oklahoma City, OK (13) 3. Houston, TX (12) 4. Chicago, IL (10) 5. Lexington, KY & Albuquerque, NM (9) |
Top
Cities - 2017* 1. Houston, TX & Milburn, NJ (9) 2. Memphis, TN & Columbus, OH (8) 3. Louisville, KY & Lexington, KY (7) 4. Polk County, FL (6) 5. Oklahoma City, OK (6) |
![]() Share on Facebook
Share on Facebook
![]() Share on Twitter
Share on Twitter
![]() Share on LinkedIn
Share on LinkedIn
|
|
Reporting Methodology:
The D&D Daily gathers retail-store specific information from public news media
sources throughout the United States and reports it daily through our
industry-renowned e-newsletter. We do not survey any retailers or third parties
nor collect information from any retail executives. All of this information is
available through public news media outlets. We do not claim nor does it
represent all such incidents or deaths that may occur in retail locations or
retail corporate facilities, as many may not be reported in the news media
depending on a number of variables outside of our control. We are not
responsible for the accuracy of the information reported in the various news
media outlets. We do not name any retailer, retail executive, suspect, or
victim.
Reposting/Sharing:
Portions of this report
or its findings may be reposted or shared with proper attribution to the D&D
Daily and a link back to this report page where possible.
Email our team to let us
know!
About The D&D Daily:
The D&D Daily is the #1
daily digital news source for the retail industry focused on retail trends, Loss
Prevention, Asset Protection and Cyber Security. Established in 2010, this
free daily e-newsletter is designed to deliver the information, news,
trends, retail crime data, technology developments, executive movement, and jobs
every day. Using a 2-minute drill type format, this '#1 copy-paste tool' allows
retail executives to see what’s important, relevant and critical, share it
throughout the organization quickly and easily, while saving the executives time
and providing them with the information they need to reduce shrink, increase
profitability and help make America’s retail stores safe. Visit
www.D-Ddaily.net and
sign up for your free email.