|

The D&D Daily's
Exclusive & Industry's Only
Q4 & 2020
'Retail Violent Fatalities Report'
Most Yearly
Fatalities & Incidents Ever Reported
523
Fatalities in 2020 - Up 40% in Last 5 Years
485 Incidents
(Up 37%) - 123 Associate
Fatalities (Up 41%)

Analysis: Five-Year 40% Spike in Retail Fatalities Reflects Nation’s Increasing
Murder Rate & Gun Violence Trend
With murder
rates and gun violence trends skyrocketing across America, it’s no surprise to
see fatality rates continue to climb in Retail America as well – especially
given the protests and rioting around racial injustice, the historical
unemployment rates, the business failures from the COVID-19 shutdowns, and the
digital transformation retail’s going through.
With the customary retail sectors that typically experience violent criminal
acts for the most part unaffected by the shutdowns, there was no break in
violent activity for retail.
One alarming trend was the gradual movement of fatalities occurring in the
parking lots and off-premises to occurring more now in-store, virtually even
with parking lots. This has resulted in more aggressive consumers, which has
been increasingly reported over the last two years, leading to an all-time-high
70% of violent retail fatalities occurring during the commission of a crime
(robberies, burglaries, thefts).
Texas and California, the two highest populated states, continue to lead the way
in fatalities year after year. When it comes to cities, Philadelphia took the
top spot for the first time in 2020, following the civil unrest the city saw
last year.
All in all, it was a difficult year for the nation’s retailers and the violent
fatalities are continuing to increase. However, while our society itself is
struggling to find answers and resolutions to these murder rates and gun
violence, retailers can find some solace in the fact that Retail’s 5% increase
year over year in 2020 is a far cry from the numbers the majority of the major
cities are experiencing.
- Gus Downing, D&D Daily Publisher & Editor
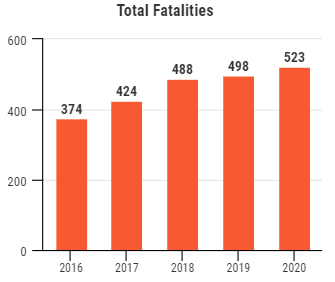
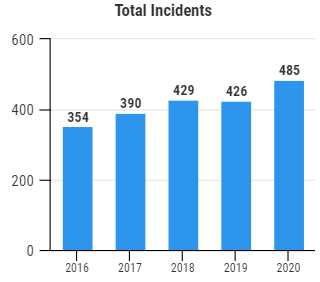
Yearly Comparison
2016 -
2017 - 2018 - 2019 - 2020
|
Up 5% From 2019
Up 40%
From 2016
 |
Up 14% From 2019
Up 37% From 2016
 |
|
•
Fatalities up
40% from 2016 & 5% from 2019
•
Incidents up 37% from 2016 & 14% from
2019
|
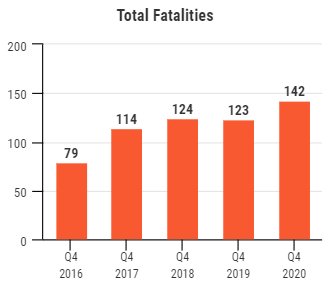
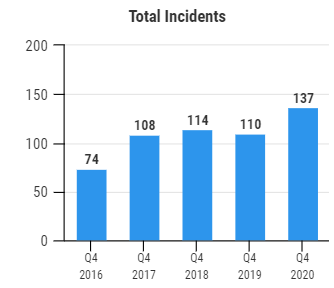
4th Quarter Comparison
2016 -
2017 - 2018 - 2019 - 2020
|
Up 15% From Q4 2019
Up 80%
From Q4 2016
|
Up 25% From Q4 2019
Up 85%
From Q4 2016
|
|
•
Fatalities up
80% from Q4 2016 & 15% from Q4 2019
•
Incidents up 85% from Q4 2016 & 25%
from Q4 2019
|

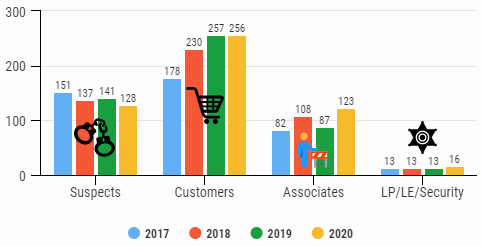
2020's
523
Retail Violent Fatalities by Category
76% Victims - 24% Suspects
256/49% Customers,
123/24% Associates, 16/3% LP/LE/Security
128/24% Suspects
|
523 Total 2020
Fatalities
• 24%,
128 Suspects - Down 9% from '19
• 49%,
256 Customers - Flat from '19
•
24%, 123 Associates - Up 41% from '19
•
3%, 16 LE/LP/Security -
Up 23% from '19 |
498 Total 2019
Fatalities
• 28%,
141 Suspects - Up 3% from '18
•
52%,
257 Customers - Up 12% from '18
•
17%, 87 Associates - Down 19% from '18
•
3%, 13 LE/LP/Security - Same as '18 |
|
488 Total 2018 Fatalities
•
28%, 137 Suspects - Down 9% from '17
•
47%,
230 Customers - Up 29% from '17
•
22%, 108 Associates - Up 32% from '17
•
3%, 13 LE/LP/Security - Same as '17
|
424
Total 2017 Fatalities
• 36%,
151 Suspects
• 42%,
178 Customers
•
19%, 82 Associates
•
3%, 13 LE/LP/Security
|
|
|
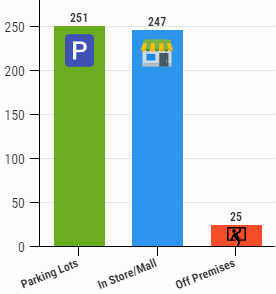
2020 Fatalities
Location
48% Parking Lots,
47% In-Store, 5% Off Premises
|
|
2020
Totals
•
48%,
251 killed in parking lots
•
47%,
247 inside store or mall
•
5%,
25 died off premises
2019
Totals
•
43%,
216 killed in parking lots
•
46%,
227 inside store or mall
•
11%,
55 died off premises
2018
Totals
•
51%,
250 killed in parking lots
•
35%,
172 inside store or mall
•
14%,
66 died off premises
2017 Totals
•
50%,
214 killed in parking lots
•
37%,
156 inside store or mall
•
13%,
54 died off premises
|
|
|
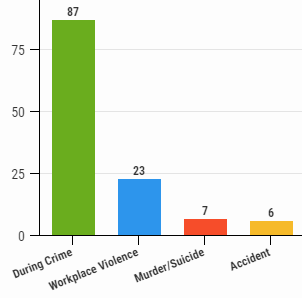
2020: 123 Associate Fatalities
70% Commission of Crime, 19% Workplace Violence
6% Murder/Suicide, 5% Accidental
|
|
2020 Totals
•
87 killed during robberies,
burglaries or thefts
•
23 killed in
argument/co-worker/workplace violence
•
7 killed in
murder/homicide/suicide
•
6 killed in accident
2019 Totals
•
54 killed during robberies,
burglaries or thefts
•
16 killed in
argument/co-worker/workplace violence
•
11 killed in
murder/homicide/suicide
•
6 killed in accident
2018 Totals
•
55 killed during robberies,
burglaries or thefts
•
19 killed in
argument/fight
•
20 killed in
murder/homicide/suicide
•
14 killed
by
former co-worker/relative/other
2017 Totals
• 58
killed during robberies, burglaries or thefts
•
10 killed in
argument/fight
•
8 killed by former
c-worker
•
5 killed by
relative/customer
•
1 killed in
murder/homicide
|
|

2020 Total Fatalities by Gender
85% Male - 15% Female
|

|
2020 Totals
•
85%,
447 Males
•
15%,
76 Females
2019 Totals
•
83%,
411 Males
•
15%,
76 Females
•
2%, 11 n/a
2018 Totals
•
77%,
377 Males
•
16%,
77 Females
•
7%,
34 n/a
2017 Totals
•
77%,
371 Males
•
16%,
42 Females
•
7%,
11 n/a
|
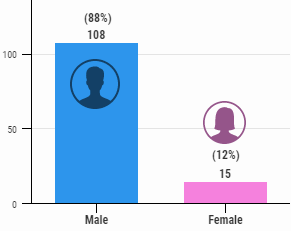
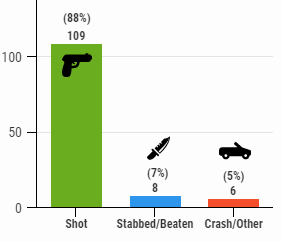
2020: 123 Associate Fatalities By Gender & Method
|
|
|
2020 Totals
•
88%,
108 Males
•
12%,
15 Females
2019 Totals
•
79%, 69 Males
•
20%,
17 Females
•
1%,
1 n/a
2018 Totals
•
69%,
74 Males
•
23%,
25 Females
•
8%,
9 n/a
2017 Totals
•
78%,
64 Males
•
18%,
15 Females
•
4%,
3 n/a
|
2020 Totals
•
88%, 109
shot
•
7%, 8
stabbed/beaten
•
5%, 6 car crash/other
2019 Totals
•
85%, 74
shot
•
10%, 8
stabbed
•
5%, 5 fire/accident/crash/other
2018 Totals
•
83%,
90 Killed by gun
•
12%, 13
stabbed/beaten
•
3%,
3
run over
•
2%,
2
medical reasons/other
2017 Totals
•
83%,
72 Killed by gun
•
12%, 7
stabbed/beaten
•
3%,
3
other
|
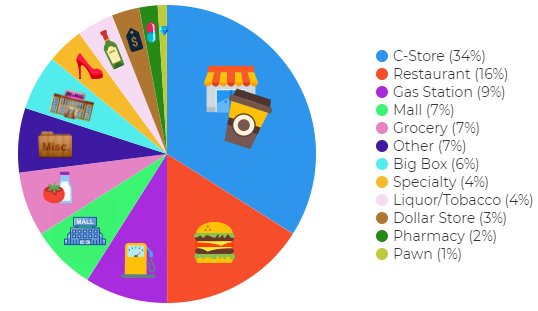
2020
Fatalities by Store Type
C-Stores Top Store Type Five Straight Years
|
2020:
1.
C-stores (34%)
2. Restaurants (16%)
3. Gas Station (9%)
4. Mall (7%)
5. Grocery (7%) |
2019:
1.
C-stores (26%)
2. Restaurants (16%)
3. Gas Station (9%)
4. Specialty (8%)
5. Big Box (8%)
|
2018:
1.
C-stores (21%)
2. Gas Stations (12%)
3. Other (11%)
4. Restaurant (10%)
5. Mall (9%)
|
2016:
1.
C-stores (26%)
2. Gas Stations (25%)
3. Big Box (21%)
4. Restaurants (9%)
5. Dollar Stores (8%)
|
2017:
1.
C-stores (18%)
2. Big Box (17%)
3. Gas Stations (12%)
4. Restaurants (9%)
5. Other (7%)
|

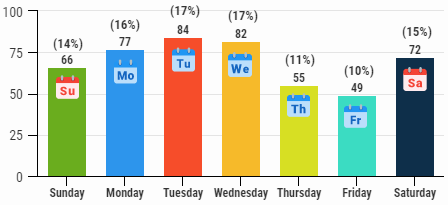
2020 Fatality Incidents by Weekday
Tuesday & Wednesday Highest - Friday Consistently Lowest
|
*2016:
1. Sunday
2. Friday
3. Saturday
4. Wednesday
5. Monday
6. Tuesday
7. Thursday
|
2017:
1. Monday - 71
2. Sunday - 63
3. Saturday - 62
4. Wednesday - 58
5. Tuesday - 56
6. Thursday - 49
7. Friday - 42
|
2018:
1. Saturday - 89
2. Wednesday - 79
3. Sunday - 77
4. Monday - 77
5. Tuesday - 70
6. Thursday - 57
7. Friday - 38
|
2019:
1. Tuesday - 78
2. Wednesday - 74
3. Thursday - 65
4. Monday - 63
5. Saturday - 63
6. Sunday - 60
7. Friday - 38
|
2020:
1. Tuesday - 84
2. Wednesday - 82
3. Monday - 77
4. Saturday - 72
5. Sunday - 66
6. Thursday - 55
7. Friday - 49 |
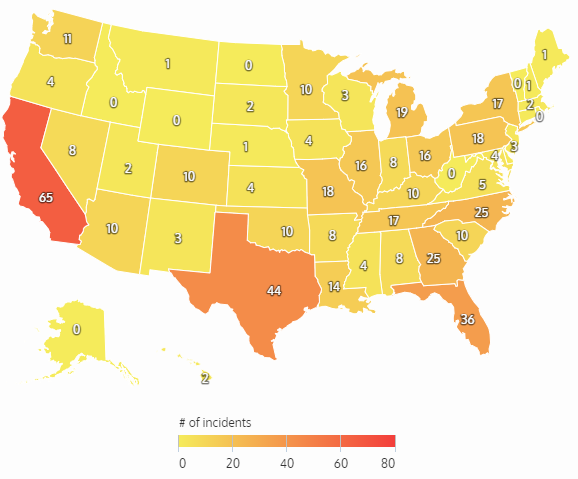
2020 Fatality Incidents by State
California & Texas Top
States for Five Straight Years
2016:
1.
Texas (43)
2. California (39)
3. Florida (31)
4. Georgia (23)
5. Ohio (7) |
2017:
1. Texas (52)
2. California (49)
3. Georgia (27)
4. Florida (25)
5. Tennessee (17) |
2018:
1. Texas (54)
2. California (45)
3. Florida (33)
4. Georgia (24)
5. New York (18) |
2019:
1. California (46)
2. Texas (44)
3. Florida (31)
4. Georgia (27)
5. North Carolina (21) |
2020:
1. California (65)
2. Texas (44)
3. Florida (36)
4. Georgia & NC (25)
5. Michigan (19) |
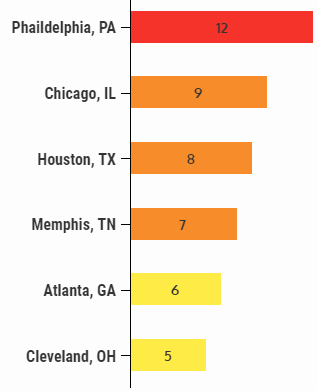
2020 Fatality Incidents by City
Philadelphia
Overtakes Houston for Most Retail Fatalities
| |
2020 Top Cities
1. Philadelphia, PA
2. Chicago, IL
3. Houston, TX
4. Memphis, TN
5. Atlanta, GA
6. Cleveland, OH
2019 Top Cities
1. Houston, TX
2. Los Angeles, CA
2. Philadelphia, PA
2. Charlotte, NC
3. Chicago, IL
4. Cleveland, OH
4. Tulsa, OK
5. Las Vegas, NV
2018 Top Cities
1. Houston, TX
2. Las Vegas, NV
2. Birmingham, AL
3. Nashville, TN
3. New Orleans, LA
3. Jacksonville, FL
2017 Top Cities
1. Houston, TX
2. Memphis, TN
3. Atlanta, GA
4. Las Vegas, NV
5. Colorado Springs, CO
2016:
1. Houston, TX
2. Atlanta, GA
3. Detroit, MI
4. Phoenix, AZ
5. Chicago, IL |
 |
| |
The D&D Daily's data tracks with other reports showing
big murder spikes in major U.S. cities.
|
Reporting Methodology:
The D&D Daily gathers retail-store specific information from public news media
sources throughout the United States and reports it daily through our
industry-renowned e-newsletter. We do not survey any retailers or third parties
nor collect information from any retail executives. All of this information is
available through public news media outlets. We do not claim nor does it
represent all such incidents or deaths that may occur in retail locations or
retail corporate facilities, as many may not be reported in the news media
depending on a number of variables outside of our control. We are not
responsible for the accuracy of the information reported in the various news
media outlets. We do not name any retailer, retail executive, suspect, or
victim.
Reposting/Sharing: Portions of this report
or its findings may be reposted or shared with proper attribution to the D&D
Daily and a link back to this report page where possible.
Email our team to let us
know!
About The D&D Daily:
The D&D Daily is the #1
daily digital news source for the retail industry focused on retail trends, Loss
Prevention, Asset Protection and Cyber Security. Established in 2010, this
free daily e-newsletter is designed to deliver the information, news,
trends, retail crime data, technology developments, executive movement, and jobs
every day. Using a 2-minute drill type format, this '#1 copy-paste tool' allows
retail executives to see what’s important, relevant and critical, share it
throughout the organization quickly and easily, while saving the executives time
and providing them with the information they need to reduce shrink, increase
profitability and help make America’s retail stores safe. Visit
www.D-Ddaily.net and
sign up for your free email.

 Share on Facebook
 Share on Twitter
 Share on LinkedIn
|
Click here to read all
of the Daily's exclusive retail crime reports
|

|