Click here to view the web version of this report
&uuid=(email))

The D&D Daily's Publicly Reported
& Industry's Only
Q3 & YTD 2020 Organized Retail Crime Report
COVID Drives ORC Cases, Dollar Amount & Suspects Down
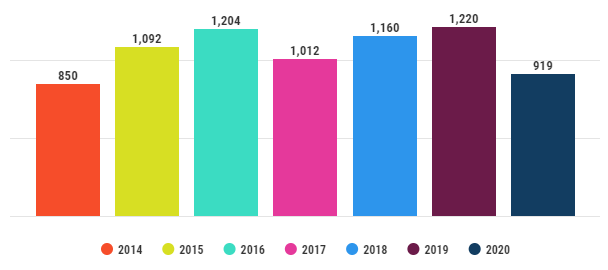
Year-To-Date
ORC Cases Down 25% Since '19 - Lowest Since '14
Q3 Dollar Amount Down 52% Since '19 - Lowest Since '16
Year-to-Date
(Q1-Q3) ORC Case Comparison - Down 25% From '19
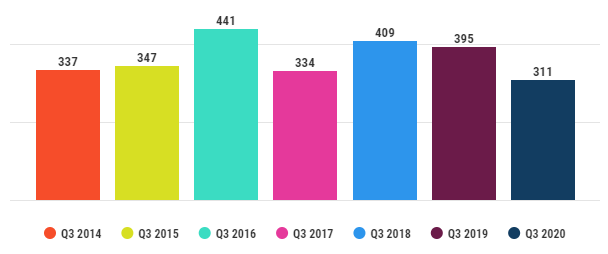
Q3 ORC Case Comparison - Down 21% From '19
| Year (Q3) | $ Amount Reported | Average $ Amount |
| 2014 | $102,678,607 (Pre-EMV roll-out) | $218,254 |
| 2015 | $56,272,683 (Pre-EMV roll-out) | $162,169 |
| 2016 | $26,731,252 | $60,615 |
| 2017 | $52,156,035 | $156,155 |
| 2018 | $38,147,479 | $93,270 |
| 2019 | $56,469,071 | $82,200 |
| 2020 | $27,049,220 | $86,974 |
•
Overall amount reported down 52% since Q3 2019 - Lowest Since 2016
• 43% increase
in average case value since Q3 2016
•
Average Case Values: Ranged from $60,615 to a high of $218,254.
•
2016 to present represents post-EMV
Special note: 2014 and 2015 amounts reflect the pre-EMV roll-out and a
larger amount of big counterfeit credit card cases.
The following high-dollar counterfeit credit card cases were excluded in
the average calculations:
• One $30M cc fraud case
on
Sept. 26, 2014
• One $24M cc/gift card fraud case
on
July 11, 2019
|
Q3 ORC Cases by Type 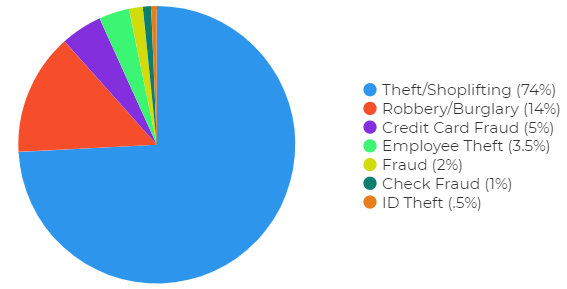 |
|
Q3 2020 • 74% Theft/Shoplifting • 14% Robbery/Burglary • 5% Credit Card Fraud |
Q3 2019 • 69% Theft/Shoplifting • 16% Robbery/Burglary • 5% Credit Card Fraud |
Q3 2018 • 64% Theft/Shoplifting • 11% Robbery/Burglary • 9% Employee theft |
|
Full Year 2017* • 67% Theft/Shoplifting • 11% Robbery/Burglary • 6% Employee theft |
Q3 2016 • 71% Theft/Shoplifting • 6% Credit Card Fraud • 5% Robbery/Burglary |
*Quarte
rly breakdown not available for 2017
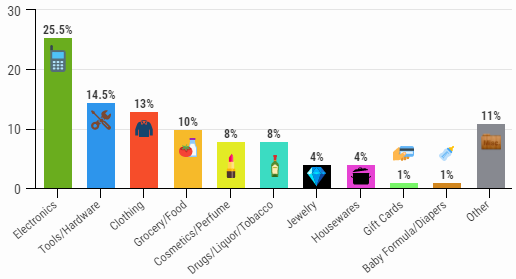
Q3 ORC Cases by Merchandise Stolen
|
Full Year 2017* • Electronics (30%) • Clothing (16%) • Jewelry (15%) |
Q3 2018 • Clothing (32%) • Electronics (21%) • Tools (16%) |
Q3 2019 • Clothing (21%) • Electronics (20%) • Tools (12%) |
Q3 2020 • Electronics (25.5%) • Tools/Hardware (14.5%) • Clothing (13%) |
*Quarterly breakdown not available for 2017 **Other includes auto, detergent, eyewear, pets, gas, guns & handbags |
|||
Q3 ORC Suspect Comparison
| Q3 | Suspects | Male | Female | Unreported | % Male | % Female |
| 2014 | 859 | 477 | 296 | 86 | 62% | 38% |
| 2015 | 845 | 417 | 258 | 170 | 62% | 38% |
| 2016 | 918 | 464 | 280 | 174 | 62% | 38% |
| 2017 | 755 | 351 | 226 | 178 | 61% | 39% |
| 2018 | 889 | 415 | 317 | 157 | 57% | 43% |
| 2019 | 986 | 572 | 321 | 93 | 64% | 36% |
| 2020 | 623 | 417 | 206 | 0 | 67% | 33% |
Fewest suspects ever recorded in publicly reported Q3
data.
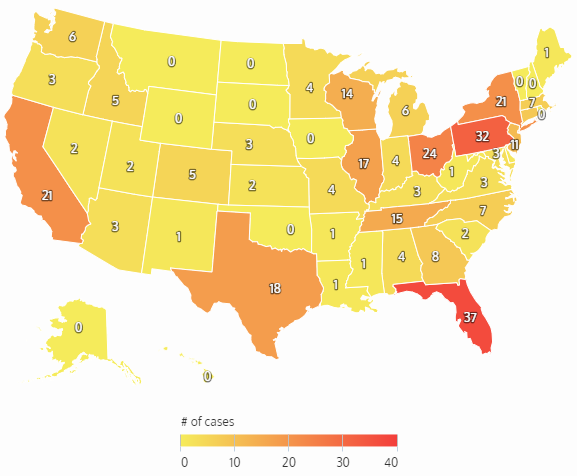
Q3
ORC Cases by State & City
|
Top States Q3 2020 1. Florida (37) 2. Pennsylvania (32) 3. Ohio (24) 4. New York & California (21) 5. Texas (18) |
Top States Q3 2019 1. California (55) 2. Florida (44) 3. Texas (26) 4. Illinois (24) 5. Pennsylvania & Georgia (18) |
|
Top States Q3 2018 1. California (48) 2. Florida (45) 3. Texas (30) 4. Pennsylvania (27) 5. Illinois (21) |
Top States in 2017* 1. California (88) 2. Florida (82) 3. Pennsylvania (68) 4. Texas (59) 5. Illinois (54) |
|
Top Cities Q3 2020 • New York City, NY (5) • Coral Springs, FL (5) • Laredo, TX (4) • Avon, OH (3) • Bloomfield, NJ (3) |
Top Cities Q3 2019 • Houston, TX (5) • Miami, FL (5) • Chicago, IL (5) • Madison, WI (5) • Oklahoma City, OK (4) |
|
Top Cities Q3 2018 • Detroit, MI (6) • Polk County, FL (5) • Miami, FL (4) • San Antonio, TX (4) • Pasco County, FL; Cape Coral, FL; Fresno, CA (3) |
Top
Cities in 2017* • Houston, TX & Milburn, NJ (9) • Memphis, TN & Columbus, OH (8) • Louisville, KY & Lexington, KY (7) • Polk County, FL (6) • Oklahoma City, OK (6) |
*Quarterly city & state breakdown not available for 2017
![]() Share on Facebook
Share on Facebook
![]() Share on Twitter
Share on Twitter
![]() Share on LinkedIn
Share on LinkedIn
|
|
Methodology: The Daily
collects this retail store specific information from public news media
sources throughout the United States and reports it daily in our Organized
Retail Crime column. We do not survey any retailers or third parties nor collect
information from any retail executive. All of this information is available
through public news media outlets. We do not claim nor does it represent all
such incidents or deaths that may occur in retail locations or retail
corporate facilities as many may not be reported in the news media depending
on a number of variables outside of our control. We are not responsible for
the acccuracy of the information reported in the various news media outlets.
We do not name any retailer, retail executive, suspect, or victim.
Copyright: We reserve the rights to this industry exclusive
report and do not authorize its republication or reproduction without
written consent which may include a fee. By re-publishing or reproducing
this report or any parts of it without authorization the party agrees to pay
a fee determined by the D&D Daily.
Auror
Sponsor of the D&D
Daily’s ORC News Column
Thanks, Auror, for making this
column and this report possible.
Hey LP and AP Execs - Thank Auror!