|

The D&D Daily's
Exclusive & Industry's Only
Year-To-Date & Q3 2020
'Retail Violent Fatalities Report'
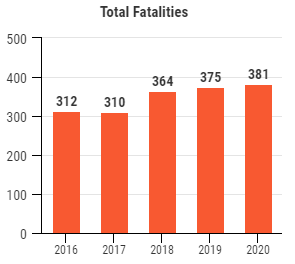
381 Fatalities
from Jan-September - Up 2% Over '19
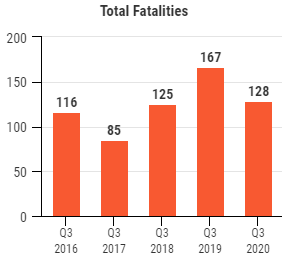
128 Q3 Fatalities - Down 23% From Q3 2019

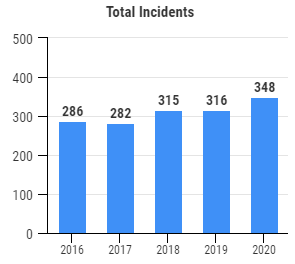
Year-to-Date Comparison
2016 -
2017 - 2018 - 2019 - 2020
|
Up 2% From 2019
Up 22%
From 2016
 |
Up 10% From 2019
Up 21.7% From 2016
 |
|
•
Fatalities Up 22% since 2016
•
Incidents Up 21.7% since 2016
•
Fatalities Up 2% Over 2019
|
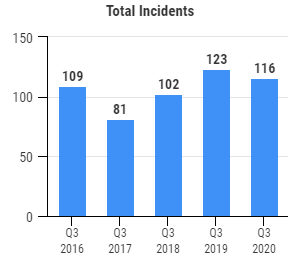
3rd Quarter Comparison
2016 -
2017 - 2018 - 2019 - 2020
|
Down 23% From Q3 2019
Up 10.3% From 2016
|
Down 5.7% From
Q3 2019
Up 6.4% From 2016
|
|
•
128 Fatalities - Up 10.3% Over 2016
•
116 Incidents - Up 6.4% Over 2016
•
Fatalities Down 23% From Q3 2019
|

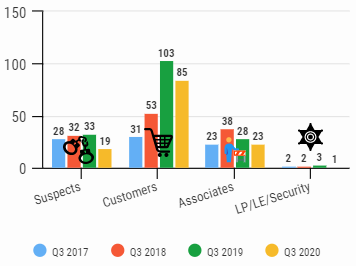
Q3
2020's 128
Retail Violent Fatalities by Category
85% Victims - 15% Suspects
23/18%
Associates - 85/66% Customers - 1/1% LP/LE/Security
19/15% Suspects
|
128 Total Q3
2020 Violent Fatalities
•
15%, 19 Suspects - down 42% from '19
• 66%, 85 Customers - down 17% from '19
• 18%, 23 Associates - down 18% from '19
• 1%, 1 LE/LP/Security - down 67% from '19
167
Total Q3 2019 Violent Fatalities
• 20%, 33 Suspects - up 3% from '18
•
61%,
103 Customers - up 94% from '18
• 17%, 28 Associates - down 26% from '18
•
2%, 3
LE/LP/Security - up 50% from '18
125
Total Q3 2018 Violent Fatalities
• 26%, 32 Suspects - up 14% from '17
•
42%,
53 Customers - up 71% from '17
•
30%,
38 Associates - up 65% from '17
• 2%, 2 LE/LP/Security - flat from '17
85
Total Q3 2017 Violent Fatalities
• 33%, 28 Suspects
• 37%, 31 Customers
• 27%, 23 Associates
• 3%, 2 LE/LP/Security
|
|
|
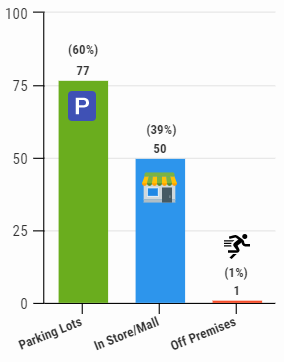
Q3 2020 Fatalities
Location
39% In-Store,
60% Parking Lots,
1% Off Premises
|
|
Q3 2020
Totals
•
39%, 50 inside store or mall
•
60%,
77 killed in parking lots
•
1%, 1 died off premises
Q3
2019
Totals
•
45%, 75 killed in parking lots
•
48%, 80 inside store
or mall
•
7%, 12 died off premises
Q3
2018 Totals
•
54.5%, 68 killed in parking lots
•
34.5%, 43 inside store or mall
•
11%, 14 died off premises
or unaccounted
Q3
2017 Totals
•
49%,
42
killed in parking lots
•
39%, 33 inside store or mall
•
12%, 10 died off premises
|
|
|
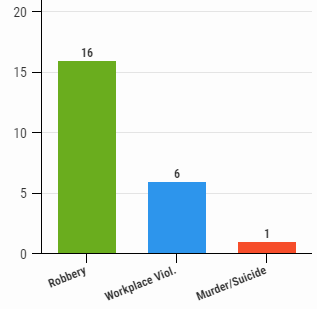
Q3 2020: 23 Associate Fatalities
70% Commission of Crime, 26% Workplace Violence
4%
Murder/Suicide
|
|
Q3 2020 Totals
• 16 (70%) killed during robberies
• 6 (26%) killed in workplace
violence incidents
•
1
(4%) killed in
murder/suicide
Q3 2019 Totals
• 15 (54%) killed during robberies
• 6 (21%) killed in workplace
violence incidents
•
5
(18%) killed in
murder/suicide
•
2
(7%) killed
in accidents
Q3
2018 Totals
•
15 (39%) killed during robberies
•
17 (45%) killed in shootings/homicide/fight
•
6 (16%) killed by co-worker/employee/relative
Q3
2017 Totals
• 14
(61%) killed during robberies
• 6 (26%)
killed in deadly confrontation
• 2 (9%)
killed by current employee
• 1 (4%)
killed by relative
|
|

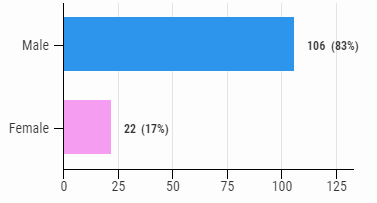
Q3 2020 Total Fatalities by Gender
83% Male - 17% Female
|
Q3
2020 Totals
•
83%, 106 Males
•
17%, 22 Females
Q3 2019 Totals
•
80%, 133 Males
•
20%, 34 Females
Q3 2018 Totals
•
80%, 100 Males
•
13%, 16 Females
•
7%, 9
Not listed
Q3 2017 Totals
•
85%, 72 Males
•
7%, 6 Females
•
8%, 7 Not
listed
|
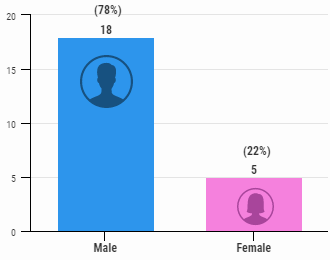
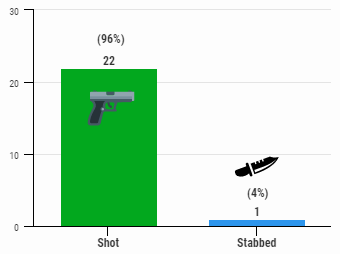
Q3 2020 - 23 Associate Fatalities By Gender & Method
|
|
 |
|
Q3
2020 Totals
•
78%, 18 Males
•
22%, 5 Females
Q3
2019 Totals
•
75%, 21 Males
•
25%, 7 Females
Q3
2018 Totals
•
66%, 25 Males
•
21%, 8 Females
•
13%, 5 n/a
Q3
2017 Totals
•
87%, 20 Males
•
9%, 2 Females
•
4%, 1 n/a
|
Q3 2020 Totals
•
96%, 22
shot
•
4%, 1
stabbed
Q3 2019 Totals
•
86%, 24
shot
•
7%, 2
stabbed
•
7%, 2 crushed
Q3 2018 Totals
•
86%, 33
shot
•
7%, 3
stabbed
•
3%,
1 beaten
•
3%,
1 dragged
by car
Q3 2017 Totals
•
96%, 22 shot
•
4%, 1
not listed
|
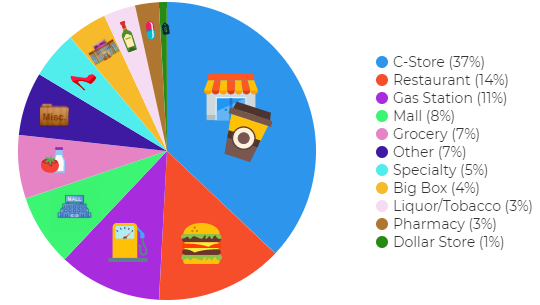
Q3 2020
Fatality Incidents by Store Type
C-Stores Top Store Type Five Straight Years
|
Q3 2020:
1.
C-stores (37%)
2. Restaurants (14%)
3. Gas Stations (11%)
4. Mall (8%)
5. Grocery (7%)
|
Q3 2019:
1.
C-stores (27%)
2. Restaurants (18%)
3. Gas Stations (11%)
4. Big Box (8%)
5. Specialty (8%)
|
Q3
2018:
1.
C-stores (26%)
2. Other (14%)
3. Restaurants (12%)
4. Specialty (10%)
5. Gas Stations (10%)
|
Q3 2017:
1.
C-stores (28%)
2. Grocery (13%)
3. Restaurants (13%)
4. Big Box (8%)
5. Specialty (8%)
|
2016:
1.
C-stores (26%)
2. Gas Stations (25%)
3. Big Box (21%)
4. Restaurants (9%)
5. Dollar Stores (8%)
|

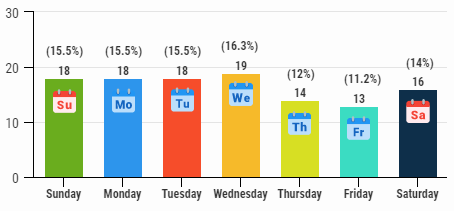
Q3 2020 Fatality Incidents by Weekday
Wednesday Highest - Two Out of Last Three Years
|
|
2016:
1. Sunday
2. Friday
3. Saturday
4. Wednesday
5. Monday
6. Tuesday
7. Thursday |
Q3 2017:
1. Sunday - 14
1. Saturday - 14
1. Tuesday - 14
2. Monday - 13
3. Wednesday - 12
4. Thursday - 7
4. Friday - 7 |
Q3 2018:
1. Saturday - 32
2. Sunday - 18
2. Thursday - 18
3. Monday - 17
3. Tuesday - 17
5. Wednesday - 15
5. Friday - 8 |
Q3 2019:
1.
Wednesday - 27
2. Sunday - 19
2. Monday - 19
3. Tuesday - 18
4. Saturday - 17
5. Thursday - 13
6. Friday - 10 |
Q3 2020:
1.
Wednesday - 19
2. Sunday - 18
2. Monday - 18
2. Tuesday - 18
3. Saturday - 16
4. Thursday - 14
5. Friday - 13 |
*Complete data not available
for 2016
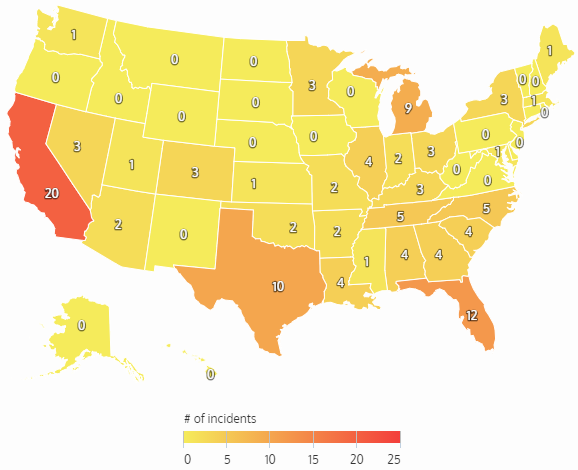
Q3 2020 Fatality Incidents by State
California, Texas Top
States 5 years
Florida #2 two years running
|
2016:
1.
Texas (43)
2. California (39)
3. Florida (31)
4. Georgia (23)
5. Ohio (7)
|
Q3 2017:
1.
Texas (9)
2. California (6)
3. Georgia (6)
4. Colorado (5)
5. North Carolina (5)
|
Q3 2018:
1. Texas (16)
2. California (10)
3. Maryland (8)
4. Florida (7)
5. New York (7)
|
Q3 2019:
1. California (14)
2. Florida (13)
3. Texas (12)
4. Georgia (8)
5. Virginia (6)
|
Q3 2020:
1. California (20)
2. Florida (12)
3. Texas (10)
4. Michigan (9)
5. NC & TN (5)
|
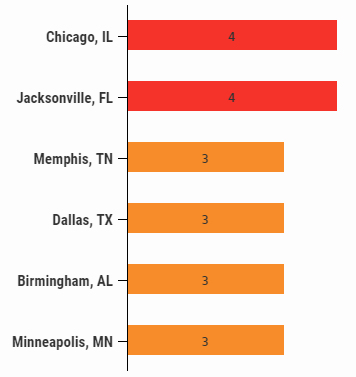
Q3 2020 Fatality Incidents by City
Texas Streak is Broken
Chicago & Jacksonville Top Cities in Q3
Texas dominated for 4 Yrs Previously
Dallas & Houston Top Cities 4 Yrs Previously
| |
Q3 2020:
1. Chicago, IL (4)
1.
Jacksonville, FL (4)
2. Memphis, TN (3)
2. Dallas, TX (3)
2. Birmingham, AL (3)
2. Minneapolis, MN (3)
Q3 2019:
1. Dallas, TX (5)
2.
DeKalb, GA (3)
3. Memphis, TN (3)
4. Chicago, IL; Philadelphia, PA; Queens, NY; San Antonio, TX; Tulsa, OK (2)
Q3
2018:
1. Houston, TX
2. Minneapolis, MN
3. Detroit, MI
4. Jacksonville, FL
5. New Orleans, LA
Q3
2017:
1. Dallas, TX
2. Colorado Springs, CO
3. Las Vegas, NV
4. Kansas City, MO
5. Houston, TX
2016:
1. Houston, TX
2. Atlanta, GA
3. Detroit, MI
4. Phoenix, AZ
5. Chicago, IL
|
|
Methodology: The Daily collects this retail store specific information
from public news media sources throughout the United States and reports it daily
in our Retail Crime column. We do not survey any retailers or third parties nor
collect information from any retail executive. All of this information is
available through public news media outlets. We do not claim nor does it
represent all such incidents or deaths that may occur in retail locations or
retail corporate facilities as many may not be reported in the news media
depending on a number of variables outside of our control. We are not
responsible for the accuracy of the information reported in the various news
media outlets. We do not name any retailer, retail executive, suspect, or
victim.
Copyright: We reserve the rights to this industry exclusive
report and do not authorize its republication or reproduction without written
consent which may include a fee. By re-publishing or reproducing this report or
any parts of it without authorization the party agrees to pay a fee determined
by the D&D Daily.
 Share on Facebook
 Share on Twitter
 Share on LinkedIn
|
Click here to read all
of the Daily's exclusive retail crime reports
|
|