Click here to view the web version of this report
 

Advertisement


The D&D Daily's Publicly Reported
Mid-Year & Q2 2020 Robbery Report

Robberies Up 11% From 2016, 4% From 2019
Most Incidents Ever Reported in Mid-Year 2020, But COVID Drives Q2 Drop

C-Stores & Restaurants Top Targets - Chicago Surges to #1 - Monday Top Day


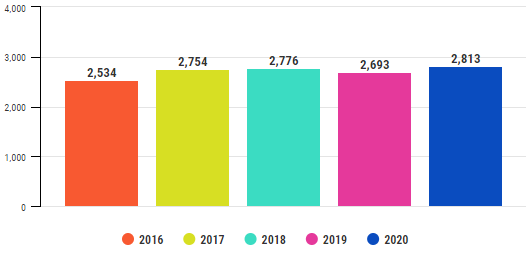
Mid-Year Robbery Comparison - 2016-2020
Up 4% Since 2019 & 11% Since 2016


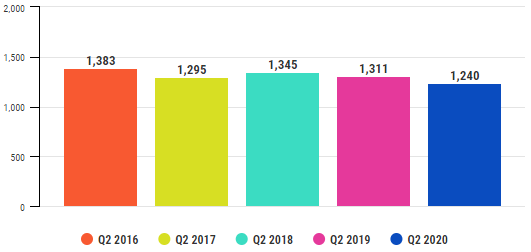
Q2 Robbery Comparison - 2016-2020
Down 5% Since '19 - Lowest Q2 On Record


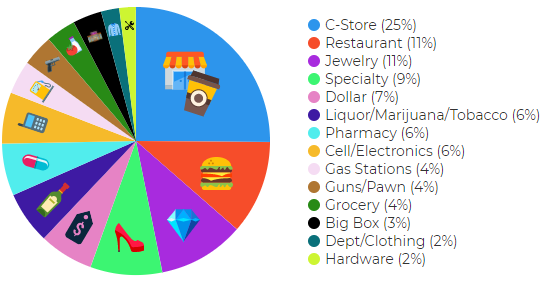
Mid-Year 2020 Robberies & Burglaries by Store Type

Mid-Year 2020:
1. C-Store (25%)
2. Restaurant (11%)
3. Jewelry (11%)
4. Specialty (9%)
5.
Dollar (7%)
 
Mid-Year 2019:
1. C-Store (31.2%)
2. Restaurant (10.5%)
3. Cell Phone (9%)
4. Dollar Store (8.4%)
5.
Specialty (7.7%)
 
Mid-Year 2018:
1. C-Store (44%)
2. Restaurant (11.3%)
3. Pharmacy (9.8%)
4. Dollar Store (9.3%)
5.
Cell Phone (9%)
 
Mid-Year 2017:
1. C-Store (51%)
2. Pharmacy (15%)
3. Dollar Store (14%)
4. Liquor Stores (5%)
5. Cell Phone (4%)


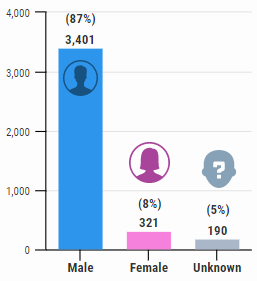
Mid-Year 2020 Suspects by Gender

3,912 Total Suspects

Mid-Year 2020 Suspect Breakdown:
3,401 males, 321 females, 190 unknown

Mid-Year 2019 Suspect Breakdown:

3,767 males, 179 females, 15 unknown

Mid-Year 2018
Suspect Breakdown:
3,130 males, 158 females, 414 unknown


*2017 Suspect Breakdown:
4,505 males, 238 females, 486 unknown

*Started collecting 2017 data in Q2


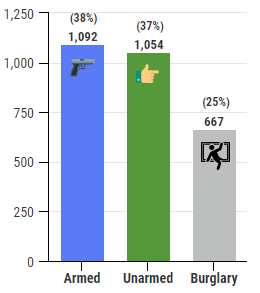
Mid-Year 2020 Armed vs. Unarmed

Mid-Year 2020 Breakdown:
1,092 armed, 1,054 unarmed, 667 burglaries


Mid-Year 2019
Breakdown:
1,551 armed, 522 unarmed, 620 burglaries

Mid-Year 2018 Breakdown:
1,475 armed, 1,053 unarmed, 248 n/a

2017 Armed-Unarmed Breakdown*:
2,348 armed, 1,550 unarmed, 34 n/a

*Started collecting 2017 data in Q2


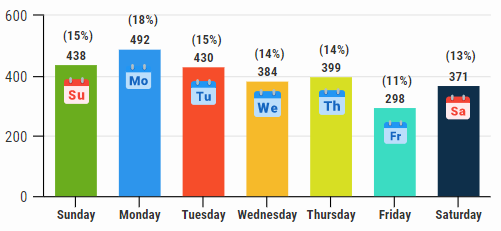
Mid-Year 2020 Robberies by Weekday
Monday Highest & Friday Lowest All Years
 

*Not all incidents reported a weekday

Mid-Year 2020
1. Monday - 492
2. Sunday - 438
3. Tuesday - 430
4. Thursday - 399
5. Wednesday - 384
6. Saturday - 371
7. Friday - 298
 

Mid-Year 2019
1. Monday - 459
2. Tuesday - 433
3. Wednesday - 431
4. Sunday - 373
5. Thursday - 361
6. Saturday - 323
7. Friday - 292
 

Mid-Year 2018
1. Monday - 491
2. Wednesday - 464
3. Tuesday - 461
4. Sunday - 416
5. Thursday - 333
6. Saturday - 306
7. Friday - 305
 

*2017 Days
1. Monday - 538
2. Tuesday - 519
3. Sunday - 517
4. Saturday - 481
5. Wednesday - 462
6. Thursday - 406
7. Friday - 285

*2017 started collecting data in Q2


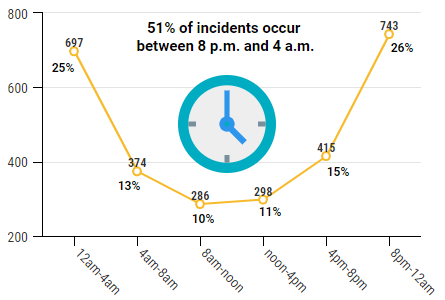
Mid-Year 2020 Robberies by Time of Day

*Times not available for all days

Mid-Year 2020
1. 8pm - 12am (743)
2. 12am - 4am (697)
3. 4pm - 8pm (415)
4. 4am - 8am (374)
5. 12pm - 4pm (298)
6. 8am - 12pm (286)
 

Mid-Year 2019
1. 8pm - 12am (681)

2. 12am - 4am (626)
3. 4am - 8am (369)
4. 4pm - 8pm (365)
5. 12pm - 4pm (250)
5. 8am - 12pm (226)
 

Mid-Year 2018
1. 8pm - 12am (563)

2. 12am - 4am (532)
3. 4pm - 8pm (334)
4. 4am - 8am (326)
5. 8am - 12pm (252)
6. 12pm - 4pm (243)
 

*2017 Times
1. 12am - 4am (809)
2. 8pm - 12am (741)
3. 4pm - 8pm (431)
4. 4am - 8am (396)
5. 8am - 12pm (295)
6. 12pm - 4pm (294)

*2017 started collecting data in Q2


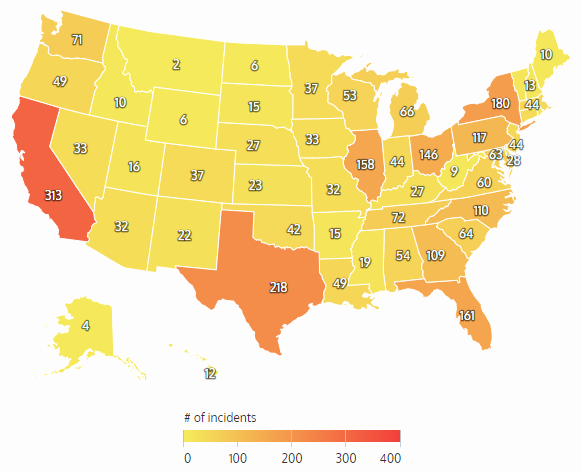
Mid-Year 2020 Robberies by State
California & Texas Highest 2016 to 2020

Mid-Year 2020
1. California (313)
2. Texas (218)
3. New York (180)
4. Florida (161)
5. Illinois (158)

Mid-Year 2019
1. California (293)
2. Texas (197)
3. Florida & Ohio (133)
4. Pennsylvania (126)
5. North Carolina (125)

Mid-Year 2018
1. California (258)
2. Texas (203)
3. Florida (134)
4. New York (125)
5. PA & NC (121)

Mid-Year 2017
1. California (231)
2. Texas (187)
3. Ohio (161)
4. Florida (160)
5. Pennsylvania (146)


Mid-Year 2016
1. Texas (199)
2. California (162)
3. Florida (144)
4. Ohio*
5. Pennsylvania*


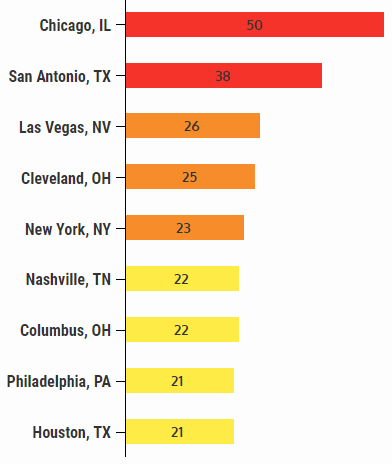
Mid-Year 2020 Robberies by City
Chicago Overtakes Houston as Mid-Year Robbery Hot Spot

Mid-Year 2020
1. Chicago, IL: 50
2. San Antonio, TX: 38
3. Las Vegas, NV: 26
4. Cleveland, OH: 25
5. New York, NY: 23


Mid-Year 2019

1. Houston, TX: 34
2. Colorado Springs, CO: 31
3. San Diego, CA: 26
4. Fresno, CA: 25
5. Tulsa, OK; Nashville, TN; Phoenix, AZ: 23


Mid-Year 2018

1. Tulsa, OK: 46 (Spiked Q1)
2. Houston, TX: 37
3. San Antonio, TX: 29
4. Charlotte, NC: 25
5. Las Vegas, NV: 15


2017 Full Year
1. Houston, TX: 60
2. Tulsa, OK: 59
3. Colorado Springs, CO: 55
4. Nashville, TN: 43
5. Chicago, IL: 40

2016 Full Year
1. Houston, TX: 73
2. Memphis, TN: 66
3. Dayton, OH: 65
4. Tulsa, OK*
5. Cleveland, OH*

*Began logging complete city data in 2017


Facebook Share on Facebook       Twitter Share on Twitter       Linkedin Share on LinkedIn


Click here to read all of the Daily's exclusive retail crime reports


Methodology: The Daily collects this retail store specific information from public news media sources throughout the United States and reports it daily in our Retail Crime column. We do not survey any retailers or third parties nor collect information from any retail executive. All of this information is available through public news media outlets. We do not claim nor does it represent all such incidents or deaths that may occur in retail locations or retail corporate facilities as many may not be reported in the news media depending on a number of variables outside of our control. We are not responsible for the accuracy of the information reported in the various news media outlets. We do not name any retailer, retail executive, suspect, or victim.

Copyright: We reserve the rights to this industry exclusive report and do not authorize its republication or reproduction without written consent which may include a fee. By re-publishing or reproducing this report or any parts of it without authorization the party agrees to pay a fee determined by the D&D Daily.


Scarsdale Security

Sponsor of the D&D Daily’s Robbery Column

Thanks, Scarsdale, for making this column and this report possible.
Hey LP and AP Execs - Thank Scarsdale Security!

Thanks to David Raizen & Jim Mahoney at Scarsdale Security for sponsoring this report!


Advertisement