Click here to view the web version of this report


The D&D Daily's Publicly Reported
Q2 & Mid-Year 2020 ORC Report
COVID Drives ORC Cases, Dollar Amount & Suspects Down
ORC Cases Drop 26% Over 2019 - Q2 2020 Hits New Low
Average Dollar Amount Down 28%

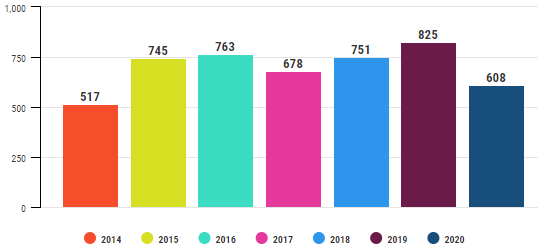
Mid-Year ORC Case Comparison
Down 26% Since '19 - 2nd Lowest On Record
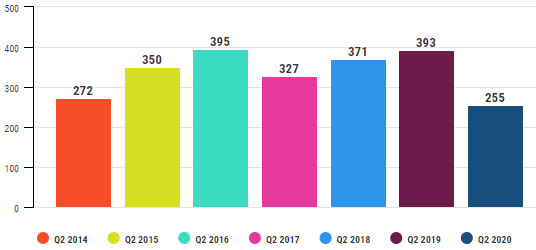
Q2 ORC Case Comparison
Down 35% Since '19 - Lowest On Record
| Year | $ Amount Reported | Average $ Amount |
| 2014 | $552,924,441 (Pre-EMV roll-out) | $295,271 |
| 2015 | $403,680,331 (Pre-EMV roll-out) | $105,611 |
| 2016 | $438,219,571 | $50,091 |
| 2017 | $213,775,372 | $64,565 |
| 2018 | $109,146,135 | $86,392 |
| 2019 | $101,238,967 | $122,713 |
| 2020 | $53,912,775 | $88,672 |
• 77%
increase since 2016 - 28% decrease since 2019
•
Average Case Values: Ranged from a low of $50,091 (2016) to a high of $295,271
(2014).
•
2016 to present represents post-EMV
Special note: 2014 and 2015 amounts reflect the pre-EMV roll-out and a
larger amount of big counterfeit credit card cases.
The following high-dollar counterfeit credit card cases where excluded in
the average calculations:
•
Two $200M cc fraud cases on
May 14 &
June 20, 2014
•
One $325M counterfeit case on
Jan. 16, 2015
•
Two $200M cc fraud cases on
Jan. 8 &
May 9, 2016
•
One $170M cc fraud case on
April 19, 2017
•
One $51M cc fraud case on
May 23, 2018
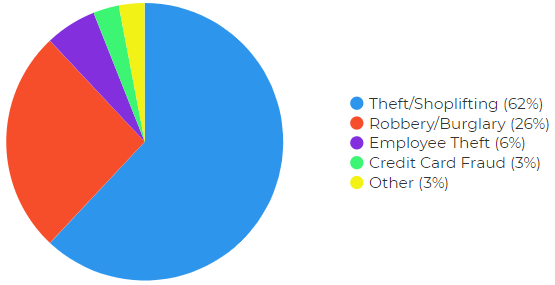
Mid-Year ORC Cases By Type
Theft/Shoplifting Top Method Five Years Running
|
|||||||
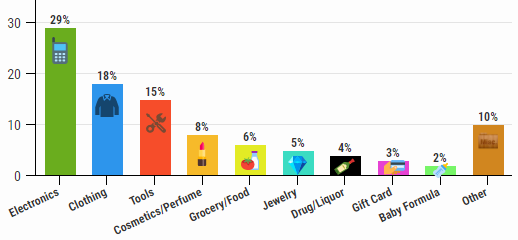
Mid-Year
ORC Cases by Merchandise Stolen
Electronics & Clothing Most Targeted
Four Years Running
|
Mid-Year 2020 • Electronics (29%) • Clothing (18%) • Tools (15%) |
Mid-Year 2019 • Electronics (22.5%) • Clothing (20.5%) • Tools (13%) |
Mid-Year 2018 • Electronics (31.5%) • Clothing (26.5%) • Tools (14.5%) |
Full Year 2017* • Electronics (30%) • Clothing (16%) • Jewelry (15%) |
|
|
|||
Mid-Year ORC Suspect Comparison
Fewest Suspects Reported Since
2017
| Mid-Year | Suspects | Male | Female | Unreported | % Male | % Female |
| 2014 | 1,355 | 846 | 493 | 16 | 63% | 37% |
| 2015 | 1,719 | 952 | 530 | 237 | 64% | 36% |
| 2016 | 1,666 | 864 | 501 | 301 | 63% | 37% |
| 2017 | 1,358 | 602 | 419 | 337 | 59% | 41% |
| 2018 | 1,598 | 841 | 511 | 246 | 62% | 38% |
| 2019 | 1,712 | 842 | 509 | 361 | 62% | 38% |
| 2020 | 1,384 | 946 | 429 | 9 | 69% | 31% |
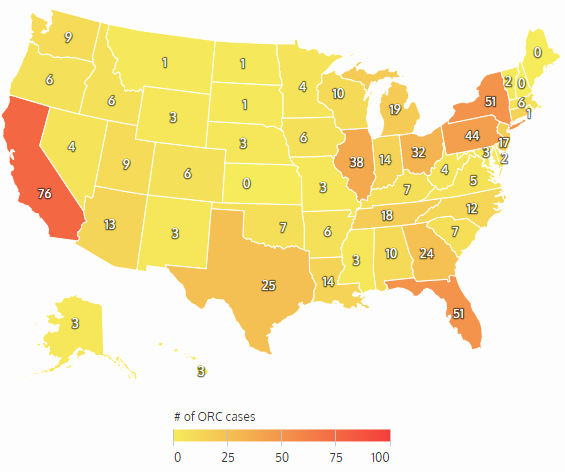
Mid-Year ORC Cases by State
California, Florida & New
York Top States
|
Top States Mid-Year 2020 |
Top States Mid-Year 2019 |
Top States Mid-Year 2018 |
|
Top States in 2017 |
Top
States in 2016 |
|
![]() Share on Facebook
Share on Facebook
![]() Share on Twitter
Share on Twitter
![]() Share on LinkedIn
Share on LinkedIn
|
|
Methodology: The Daily
collects this retail store specific information from public news media
sources throughout the United States and reports it daily in our Organized
Retail Crime column. We do not survey any retailers or third parties nor collect
information from any retail executive. All of this information is available
through public news media outlets. We do not claim nor does it represent all
such incidents or deaths that may occur in retail locations or retail
corporate facilities as many may not be reported in the news media depending
on a number of variables outside of our control. We are not responsible for
the accuracy of the information reported in the various news media outlets.
We do not name any retailer, retail executive, suspect, or victim.
Copyright: We reserve the rights to this industry exclusive
report and do not authorize its republication or reproduction without
written consent which may include a fee. By re-publishing or reproducing
this report or any parts of it without authorization the party agrees to pay
a fee determined by the D&D Daily.
Auror
Sponsor of the D&D
Daily’s ORC News Column
Thanks, Auror, for making this
column and this report possible.
Hey LP and AP Execs - Thank Auror!