&uuid=(email))

The D&D Daily's
Publicly Reported
Q1 2020
Robbery Report
Robberies Up 37% From 2016, 14% From 2019
Most Incidents Ever
Reported in Q1
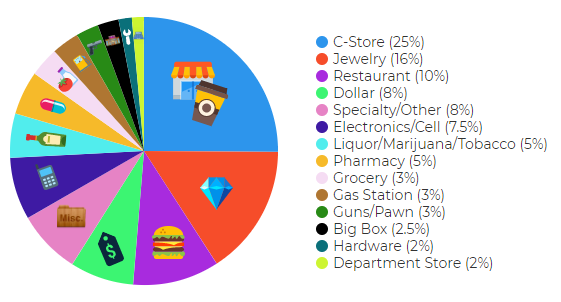
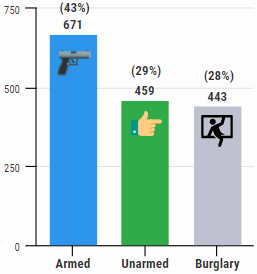
C-Stores & Jewelry Top Retail Sector -
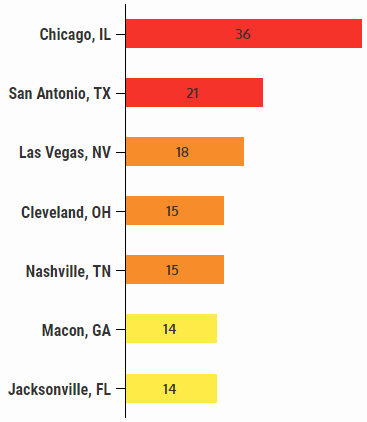
Chicago New Hot Spot - Monday Top Day

Yearly & Quarterly Comparison
2016-2020
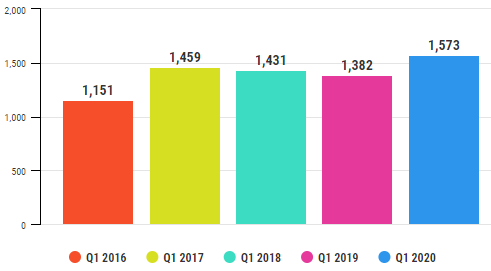
Q1 Robberies Up 37% From 2016 - 14% from Last Year
Q1 Comparison
- 2016-2020
• 2020 - 1,573 robberies
(up 14% from Q1 '19)
• 2019 - 1,382 robberies
(down 3.4% from Q1 '18)
• 2018 - 1,431 robberies
(down 1.9% from Q1 '17)
• 2017 - 1,459 robberies
(up 27% from Q1 '16)
• 2016 - 1,151 robberies
Increased Violence in Retail Crime Overall Continues
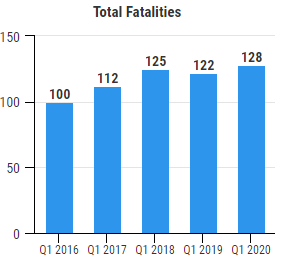
Fatalities Spike of 28%
Combined with Robbery Spike of 37%
Shows Increased Retail Crime Overall Since 2016
Click here to read the Q1 2020 Retail Violent Fatalities Report
|
Q1 2020: |
Q1 2019: |
Q1 2018: |
|
*Q1 2017: |
*Q1 2016: |
*2016 & 2017 data did not include percentages
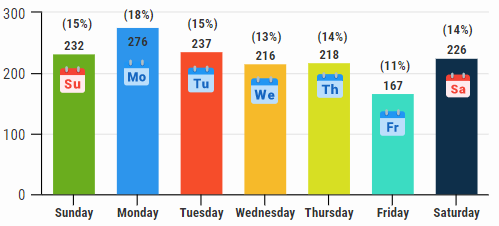
Q1 2020 Robberies by Weekday Monday Highest & Friday Lowest All Years
*Not all incidents reported a weekday
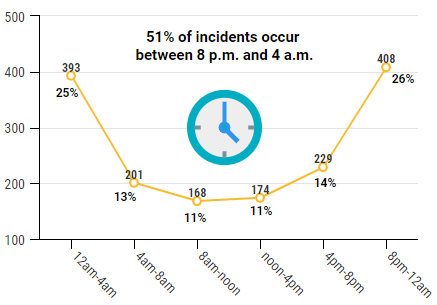
* Times not available for all days
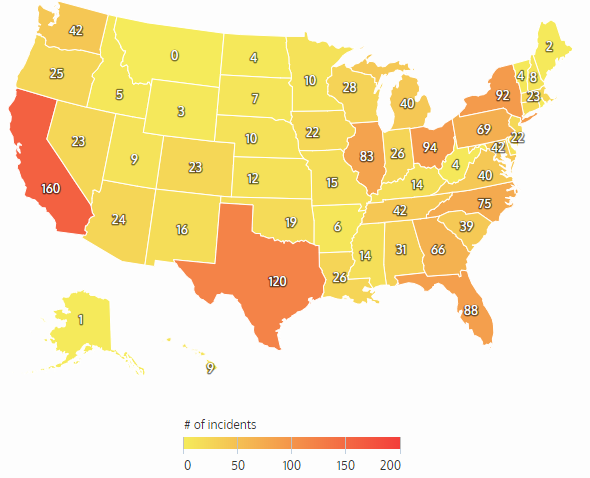
Q1 2020 Robberies by State California & Texas Highest 2016 to 2020
|
![]() Share on Facebook
Share on Facebook
![]() Share on Twitter
Share on Twitter
![]() Share on LinkedIn
Share on LinkedIn
|
|
Methodology: The Daily collects this retail store specific information
from public news media sources throughout the United States and reports it daily
in our Retail Crime column. We do not survey any retailers or third parties nor
collect information from any retail executive. All of this information is
available through public news media outlets. We do not claim nor does it
represent all such incidents or deaths that may occur in retail locations or
retail corporate facilities as many may not be reported in the news media
depending on a number of variables outside of our control. We are not
responsible for the accuracy of the information reported in the various news
media outlets. We do not name any retailer, retail executive, suspect, or
victim.
Copyright: We reserve the rights to this industry exclusive
report and do not authorize its republication or reproduction without written
consent which may include a fee. By re-publishing or reproducing this report or
any parts of it without authorization the party agrees to pay a fee determined
by the D&D Daily.
Scarsdale Security
Sponsor of the D&D Daily’s Robbery Column
Thanks, Scarsdale, for making this column and this report possible.
Hey LP and AP Execs - Thank Scarsdale Security!
Thanks to David Raizen & Jim Mahoney at Scarsdale Security for sponsoring this report!
