|

The D&D Daily's
Exclusive - Publicly Reported
Q3 2019
'Retail Fatalities Report'
375 Retail
Fatalities from Jan-September - Up 3% from 2018
167 Retail
Fatalities in Q3 2019 - Up 34% from Q3 2018
Customer Deaths Nearly Double Since 2018
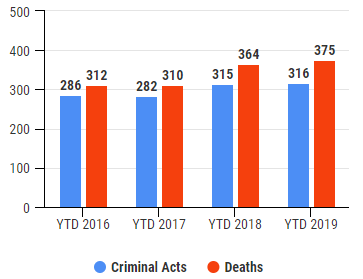
Year-to-Date
2016 -
2017 - 2018 - 2019
|
YTD Fatalities Up 3% since '18
YTD Criminal Acts Flat since '18
YTD Fatalities Up 21% since '17
YTD Criminal Acts Up 12% since '17
YTD Deaths Up 20% since '16
YTD Criminal Acts Up 10% since '16
|
|
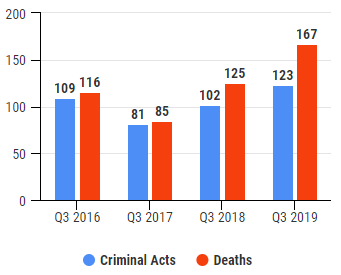
3rd
Quarter
2016 -
2017 - 2018 - 2019
| |
Q3 Fatalities Up 34% since '18*
Q3 Criminal Acts Up 21% since '18
Q3 Fatalities Up 96% since '17
Q3 Criminal Acts Up 52% since '17
Q3 Deaths Up 44% since '16
Q3 Criminal Acts Up 13% since '16 |
 |
|
*El Paso & Dayton Mass Shootings Impact Number of Fatalities
While there was a substantial increase in the number of Q3 retail fatalities,
one contributing factor was the mass shootings at an
El Paso Walmart (22 fatalities) and a Dayton bar (9 fatalities).
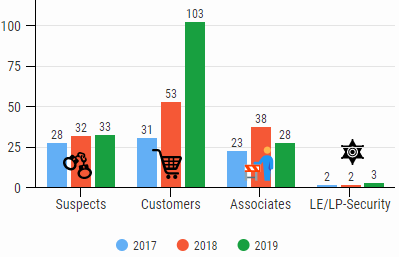
Q3 2019's
167
Retail Violent Fatalities by Category
20% Suspects - 80% Victims
33 Suspects, 103
Customers, 28 Associates, 3 LP/LE/Security
|
167 Total Q3 2019 Violent
Fatalities
• 20%,
33 Suspects - up 3% from '18
• 61%,
103 Customers - up 94% from '18
•
17%, 28 Associates - down 26% from '18
•
2%, 3
LE/LP/Security* - up 50% from '18
125
Total Q3
2018 Violent
Fatalities
• 26%,
32 Suspects - up 14% from '17
•
42%, 53 Customers - up
71% from '17
•
30%, 38 Associates - up 65% from '17
•
2%, 2 LE/LP/Security - flat from '17
85
Total
Q3
2017 Violent
Fatalities
• 33%,
28 Suspects
• 37%,
31 Customers
•
27%, 23 Associates
•
3%, 2
LE/LP/Security
|
|
|
|
*3
Law Enforcement/Security Officers Killed in Retail Violence Incidents
Sadly, three law enforcement and security officers were among the Q3 retail
fatalities.
On July 9,
a deputy
was killed in Gainesville, Georgia chasing a robbery suspect.
On Aug. 8, a
7-Eleven security guard
was killed in a stabbing rampage. And
on Aug. 13,
a security guard
was shot and killed during an arcade room robbery.
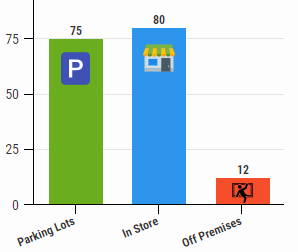
Q3 Fatalities In Parking Lot, In Store & Off Premises
|
|
Q3
2019
Totals
•
45%, 75 killed in parking lots
•
48%, 80 inside store
or mall
•
7%, 12 died off premises
Q3
2018 Totals
•
54.5%, 68 killed in parking lots
•
34.5%, 43 inside store or mall
•
11%, 14 died off premises
or unaccounted
Q3
2017 Totals
•
49%,
42
killed in parking lots
•
39%, 33 inside store or mall
•
12%, 10 died off premises
|
|
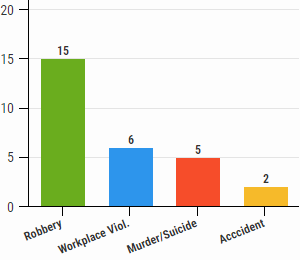
Q3: 28 Associate Fatalities
|
Q3 2019 Totals
• 15 (54%) killed during robberies
• 6 (21%) killed in workplace
violence incidents
•
5
(18%) killed in
murder/suicide
•
2
(7%) killed
in accidents
Q3
2018 Totals
•
15 (39%) killed during robberies
•
17 (45%) killed in shootings/homicide/fight
•
6 (16%) killed by co-worker/employee/relative
Q3
2017 Totals
• 14
(61%) killed during robberies
• 6 (26%)
killed in deadly confrontation
• 2 (9%)
killed by current employee
• 1 (4%)
killed by relative
|
 |
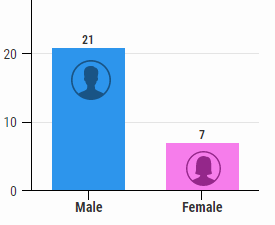
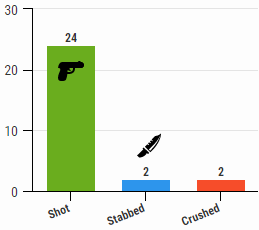
Q3: 28 Associate Fatalities By Gender & Method
|
 |
|
Q3
2019 Totals
•
75%, 21 Males
•
25%, 7 Females
Q3
2018 Totals
•
66%, 25 Males
•
21%, 8 Females
•
13%, 5 n/a
Q3
2017 Totals
•
87%, 20 Males
•
9%, 2 Females
•
4%, 1 n/a
|
Q3 2019 Totals
•
86%, 24
shot
•
7%, 2
stabbed
•
7%, 2 crushed
Q3 2018 Totals
•
86%, 33
shot
•
7%, 3
stabbed
•
3%,
1 beaten
•
3%,
1 dragged
by car
Q3 2017 Totals
•
96%, 22 shot
•
4%, 1
not listed
|
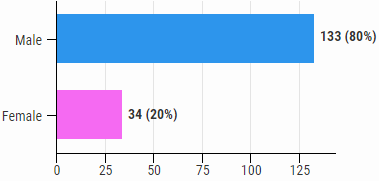
Q3 Fatalities by Gender
|
Q3 2019 Totals
•
80%, 133 Males
•
20%, 34 Females
Q3 2018 Totals
•
80%, 100 Males
•
13%, 16 Females
•
7%, 9
Not listed
Q3 2017 Totals
•
85%, 72 Males
•
7%, 6 Females
•
8%, 7 Not
listed
|

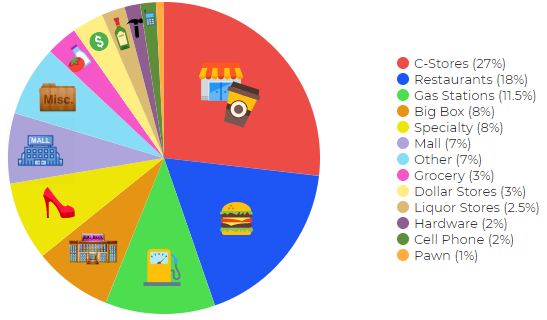
Q3
Fatalities by Store Type
C-Stores Top Store Type Four Straight Years
|
2016:
1.
C-stores (26%)
2. Gas Stations (25%)
3. Big Box (21%)
4. Restaurants (9%)
5. Dollar Stores (8%)
|
Q3 2017:
1.
C-stores (28%)
2. Grocery (13%)
3. Restaurants (13%)
4. Big Box (8%)
5. Specialty (8%)
|
Q3
2018:
1.
C-stores (26%)
2. Other (14%)
3. Restaurants (12%)
4. Specialty (10%)
5. Gas Stations (10%) |
Q3 2019:
1.
C-stores (27%)
2. Restaurants (18%)
3. Gas Stations (11%)
4. Big Box (8%)
5. Specialty (8%) |
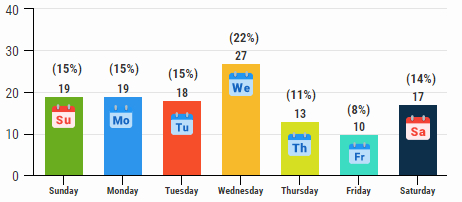
Q3 Fatality Incidents by Weekday
Wednesday Highest - Friday Consistently Lowest
2016:
1. Sunday
2. Friday
3. Saturday
4. Wednesday
5. Monday
6. Tuesday
7. Thursday
|
Q3 2017:
1. Sunday - 14
1. Saturday - 14
1. Tuesday - 14
2. Monday - 13
3. Wednesday - 12
4. Thursday - 7
4. Friday - 7
|
Q3 2018:
1. Saturday - 32
2. Sunday - 18
2. Thursday - 18
3. Monday - 17
3. Tuesday - 17
5. Wednesday - 15
5. Friday - 8
|
Q3 2019:
1.
Wednesday - 27
2. Sunday - 19
2. Monday - 19
3. Tuesday - 18
4. Saturday - 17
5. Thursday - 13
6. Friday - 10
|
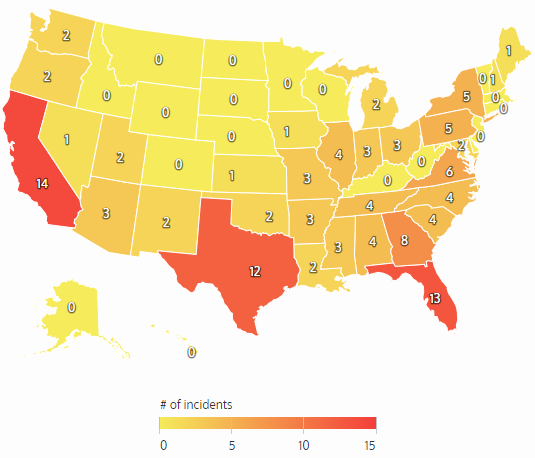
Q3 Fatality Incidents by State
California Surpasses Texas as Top State
2016:
1.
Texas (43)
2. California (39)
3. Florida (31)
4. Georgia (23)
5. Ohio (7) |
Q3 2017:
1.
Texas (9)
2. California (6)
3. Georgia (6)
4. Colorado (5)
5. North Carolina (5) |
Q3 2018:
1. Texas (16)
2. California (10)
3. Maryland (8)
4. Florida (7)
5. New York (7) |
Q3 2019:
1. California (14)
2. Florida (13)
3. Texas (12)
4. Georgia (8)
5. Virginia (6) |
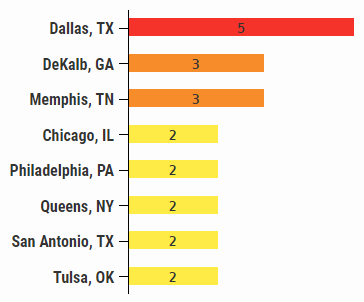
Q3 Fatality Incidents by City
Dallas Most Deaths - 2 out of 4 Years
| |
Q3 2019:
1. Dallas, TX (5)
2.
DeKalb, GA (3)
3. Memphis, TN (3)
4. Chicago, IL; Philadelphia, PA; Queens, NY; San Antonio, TX; Tulsa, OK (2)
Q3
2018:
1. Houston, TX
2. Minneapolis, MN
3. Detroit, MI
4. Jacksonville, FL
5. New Orleans, LA
Q3
2017:
1. Dallas, TX
2. Colorado Springs, CO
3. Las Vegas, NV
4. Kansas City, MO
5. Houston, TX
2016:
1. Houston, TX
2. Atlanta, GA
3. Detroit, MI
4. Phoenix, AZ
5. Chicago, IL |
 |
Methodology: The Daily collects this retail store specific information
from public news media sources throughout the United States and reports it daily
in our Retail Crime column. We do not survey any retailers or third parties nor
collect information from any retail executive. All of this information is
available through public news media outlets. We do not claim nor does it
represent all such incidents or deaths that may occur in retail locations or
retail corporate facilities as many may not be reported in the news media
depending on a number of variables outside of our control. We are not
responsible for the accuracy of the information reported in the various news
media outlets. We do not name any retailer, retail executive, suspect, or
victim.
Copyright: We reserve the rights to this industry exclusive
report and do not authorize its republication or reproduction without written
consent which may include a fee. By re-publishing or reproducing this report or
any parts of it without authorization the party agrees to pay a fee determined
by the D&D Daily.
 Share on Facebook
 Share on Twitter
 Share on LinkedIn
|
Click here to read all
of the Daily's exclusive retail crime reports
|
Security Resources
Sponsor of the D&D Daily's Retail
Crime Column
Thanks Security Resources for making this column and
report possible.
Hey LP and AP Execs - Thank Security Resources!
|
