|


The D&D Daily's
Publicly Reported
Mid-Year &
Q2 2019
Robbery Report
Mid-Year Robberies Up
5% Since 2016; Down 4% Since 2018
C-Stores Top Target All Three Years - Monday Top Day

Mid-Year &
Quarterly Comparison
2016-2019
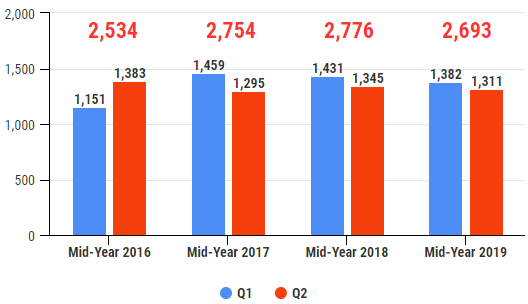
Mid-Year 2019
• 2,693 total robberies
•
Down 4% from 2018
•
Up 5% overall since 2016 |
Q2 2019
•
1,311 total robberies
• Down 3% from Q2 2018
•
Down 5% from Q1 2019 |
|
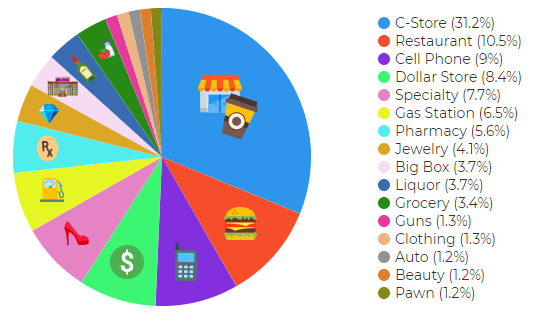
Mid-Year 2019
Robberies & Burglaries by Store Type
Mid-Year
2017:
1. C-Store (51%)
2. Pharmacy (15%)
3. Dollar Store (14%)
4. Liquor Stores (5%)
5. Cell Phone (4%)
|
Mid-Year
2018:
1. C-Store (44%)
2. Restaurant (11.3%)
3. Pharmacy (9.8%)
4. Dollar Store (9.3%)
5. Cell Phone (9%)
|
Mid-Year
2019:
1. C-Store (31.2%)
2. Restaurant (10.5%)
3. Cell Phone (9%)
4. Dollar Store (8.4%)
5. Specialty (7.7%)
|
Mid-Year 2019 Suspects by Gender
3,961 Total
Suspects
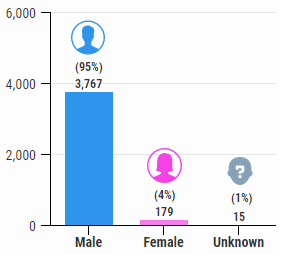
Mid-Year 2019 Suspect Breakdown:
3,767 males, 179 females, 15 unknown
Mid-Year 2018 Suspect Breakdown:
3,130 males, 158 females, 414 unknown
*2017 Suspect Breakdown:
4,505 males, 238 females, 486 unknown
*Started collecting 2017 data in Q2
|
Mid-Year 2019
Armed vs. Unarmed
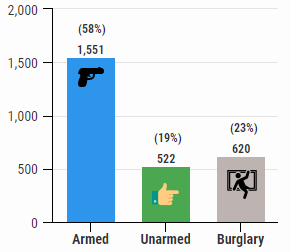
Mid-Year 2019
Breakdown:
1,551 armed, 522 unarmed, 620 burglaries
Mid-Year 2018 Breakdown:
1,475
armed, 1,053 unarmed,
248 n/a
2017
Armed-Unarmed Breakdown*:
2,348 armed, 1,550 unarmed, 34 n/a
*Started collecting 2017 data in Q2
|
Mid-Year 2019 Robberies by Weekday
Monday
Highest,
Friday Lowest
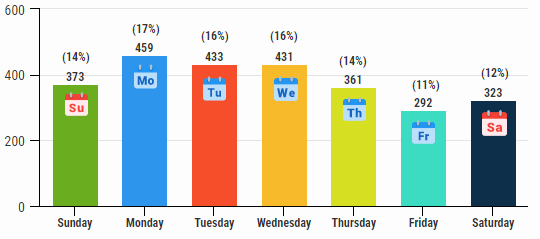
*Not all incidents reported a weekday
*2017 Days
1. Monday - 538
2. Tuesday - 519
3. Sunday - 517
4. Saturday - 481
5. Wednesday - 462
6. Thursday - 406
7. Friday - 285
*2017 started collecting data in Q2
|
Mid-Year
2018 Days
1. Monday - 491
2. Wednesday - 464
3. Tuesday - 461
4. Sunday - 416
5. Thursday - 333
6. Saturday - 306
7. Friday - 305
|
Mid-Year 2019 Days
1. Monday - 459
2. Tuesday - 433
3. Wednesday - 431
4. Sunday - 373
5. Thursday - 361
6. Saturday - 323
7. Friday - 292 |
Mid-Year 2019
Robberies by Time of Day
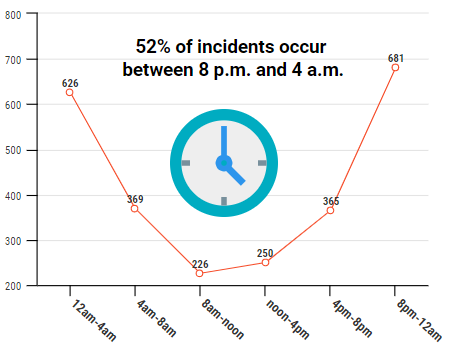
*Times not available for all days
*2017 Times
1. 12am - 4am (809)
2. 8pm - 12am (741)
3. 4pm - 8pm (431)
4. 4am - 8am (396)
5. 8am - 12pm (295)
6. 12pm - 4pm (294)
*2017 started collecting data in Q2
|
Mid-Year 2018 Times
1. 8pm - 12am (563)
2. 12am - 4am (532)
3. 4pm - 8pm (334)
4. 4am - 8am (326)
5. 8am - 12pm (252)
6. 12pm - 4pm (243) |
Mid-Year 2019 Times
1. 8pm - 12am (681)
2. 12am - 4am (626)
3. 4am - 8am (369)
4. 4pm - 8pm (365)
5. 12pm - 4pm (250)
5. 8am - 12pm (226) |
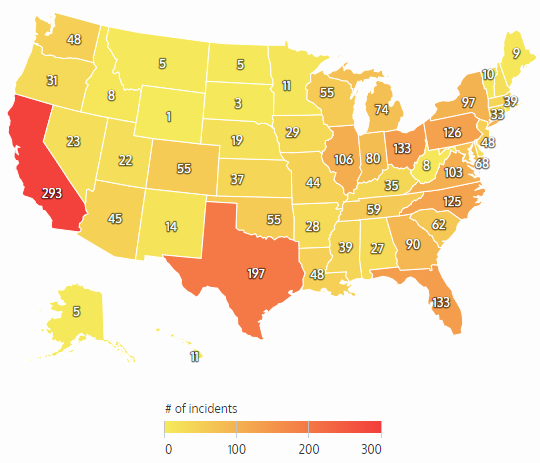
Mid-Year 2019 Robberies by State
California & Texas Highest 2016 to 2019
Mid-Year 2016
1. Texas (199)
2. California (162)
3. Florida (144)
4. Ohio*
5. Pennsylvania* |
Mid-Year 2017
1. California (231)
2. Texas (187)
3. Ohio (161)
4. Florida (160)
5. Pennsylvania (146 |
Mid-Year 2018
1. California (258)
2. Texas (203)
3. Florida (134)
4. New York (125)
5. PA & NC (121) |
Mid-Year 2019
1. California (293)
2. Texas (197)
3. Florida & Ohio (133)
4. Pennsylvania (126)
5. North Carolina (125) |
|
*Began logging complete Top 5 data in 2017
|
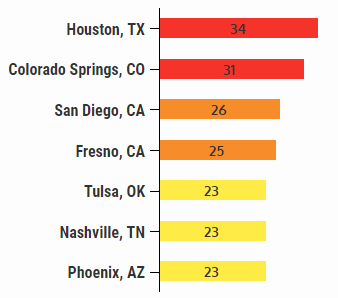
Mid-Year 2019 Robberies by City
Houston Top City 3 out of Last 4 Years
|
Mid-Year 2019
1. Houston, TX: 34
2. Colorado Springs, CO: 31
3. San Diego, CA: 26
4. Fresno, CA: 25
5. Tulsa, OK; Nashville, TN; Phoenix, AZ: 23
Mid-Year 2018
1. Tulsa, OK: 46 (Spiked Q1)
2. Houston, TX: 37
3. San Antonio, TX: 29
4. Charlotte, NC: 25
5. Las Vegas, NV: 15
2017 Full Year
1. Houston, TX: 60
2. Tulsa, OK: 59
3. Colorado Springs, CO: 55
4. Nashville, TN: 43
5. Chicago, IL: 40
2016 Full Year
1. Houston, TX: 73
2. Memphis, TN: 66
3. Dayton, OH: 65
4. Tulsa, OK*
5. Cleveland, OH*
*Began logging
complete city data in 2017 |
 |
|
|
