|


The D&D Daily's
Publicly Reported
Q1 2019
Robbery Report
Q1 Robberies Up 20% Since 2016
C-Stores & Restaurants Top Targets
Wednesday Replaces Monday for Most Robberies

Quarterly Comparison
2016-2019
|
|
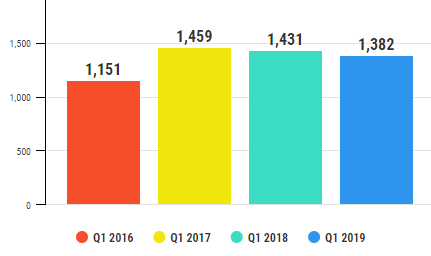
Q1 Comparison
- 2016-2019
• 2019 - 1,382 robberies
(down 3.4% from Q1 '18)
• 2018 - 1,431 robberies
(down 1.9% from Q1 '17)
• 2017 - 1,459 robberies
(up 27% from Q1 '16)
• 2016 - 1,151 robberies
|
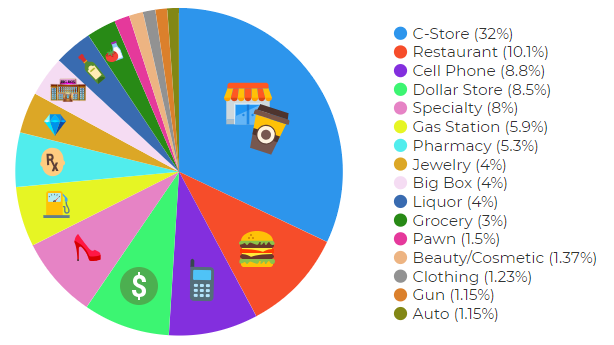
Q1 2019
Robberies & Burglaries by Store Type
*Q1 2016:
1. Dollar Store
2. Pharmacy
3. C-Store
4. Cell Phone
5. Restaurant |
*Q1
2017:
1. C-Store
2. Pharmacy
3. Dollar Store
4. Cell Phone
5. Restaurant |
Q1
2018:
1. C-Store (50%)
2. Pharmacy (12%)
3. Dollar Store (11%)
4. Restaurant (11%)
5. Cell Phone (9%) |
Q1
2019:
1. C-Store (32%)
2. Restaurant (10.1%)
3. Cell Phone (8.8%)
4. Dollar Store (8.5%)
5. Specialty (8%) |
|
*Q1 2016 & Q1 2017 data did not include percentages
|
Q1 2019
Suspects by Gender
2,016 Total
Suspects
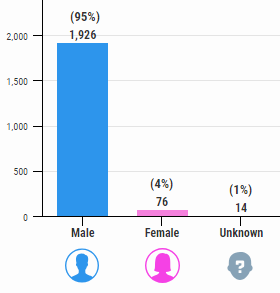
Q1 2019 Suspect Breakdown:
1,926 males, 76 females, 14 unknown
Q1 2018 Suspect Breakdown:
1,429 males, 70 females, 252 unknown
*2017 Suspect Breakdown:
4,505 males, 238 females, 486 unknown
*2017 started collecting data in Q2
|
Q1 2019
Armed vs. Unarmed
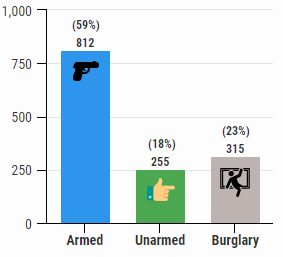
Q1 2019
Breakdown:
812 armed, 255 unarmed, 315 burglaries
Q1 2018 Breakdown:
848 armed, 582 unarmed
*2017 Breakdown:
2,348 armed, 1,550 unarmed, 34 n/a
*2017 started collecting data in Q2
|
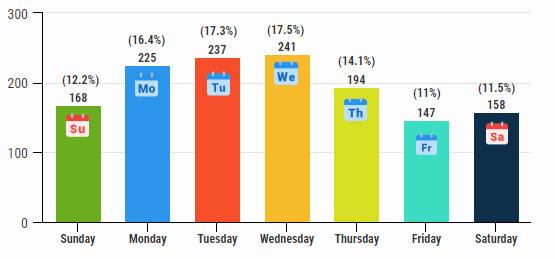
Q1 2019 Robberies by Weekday
Wednesday Highest,
Friday Lowest
*Not all incidents reported a weekday
*2017 Days Ranked
1. Monday - 538
2. Tuesday - 519
3. Sunday - 517
4. Saturday - 481
5. Wednesday - 462
6. Thursday - 406
7. Friday - 285
*2017 started collecting data in Q2
|
Q1
2018 Days Ranked
1. Monday - 225
2. Tuesday - 224
3. Sunday - 193
4. Wednesday - 180
5. Thursday - 143
6. Saturday - 119
7. Friday - 107
|
Q1 2019 Days Ranked
1. Wednesday - 241
2. Tuesday - 237
3. Monday - 225
4. Thursday - 194
5. Sunday - 168
6. Saturday - 158
7. Friday - 147 |
Q1 2019
Robberies by Time of Day
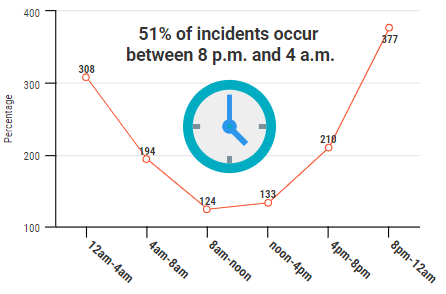
*Times not available for all days
*2017 Times Ranked
1. 12am - 4am (809)
2. 8pm - 12am (741)
3. 4pm - 8pm (431)
4. 4am - 8am (396)
5. 8am - 12pm (295)
6. 12pm - 4pm (294)
*2017 started collecting data in Q2
|
Q1 2018
Times Ranked
1. 8pm - 12am (254)
2. 12am - 4am (183)
3. 4pm - 8pm (146)
4. 4am - 8am (138)
5. 8am - 12pm (104)
6. 12pm - 4pm (146) |
Q1 2019 Times
Ranked
1. 8pm - 12am (377)
2. 12am - 4am (308)
3. 4pm - 8pm (210)
4. 4am - 8am (194)
5. 12pm - 4pm (133)
5. 8am - 12pm (124)
|
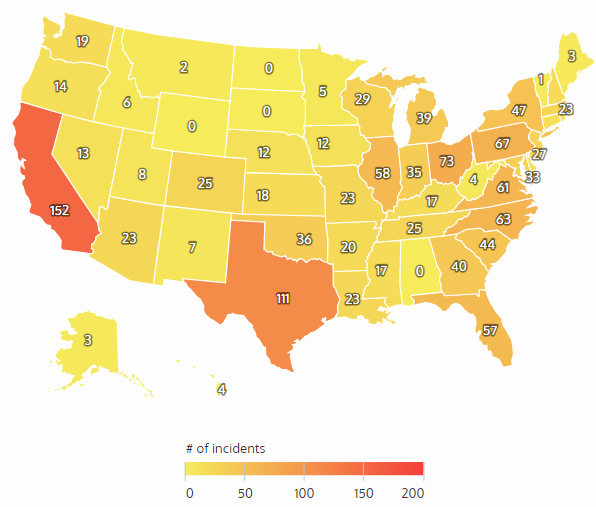
Q1 2019 Robberies by State
California & Texas Highest 2016 to 2019
Q1 2016 Ranked
1. Texas (93)
2. California (73)
3. Florida (59)
4. Ohio
5. Georgia |
Q1 2017 Ranked
1. California (125)
2. Texas (103)
3. Ohio (88)
4.
Pennsylvania (77)
5. Florida (74) |
Q1 2018 Ranked
1. California (123)
2. Texas (101)
3. Pennsylvania (73)
4. Florida (65)
5. New York (62) |
Q1 2019 Ranked
1. California (152)
2. Texas (111)
3. Ohio (73)
4.
Pennsylvania (67)
5. North Carolina (63) |
|
*Began logging complete Top 5 data in 2017
|
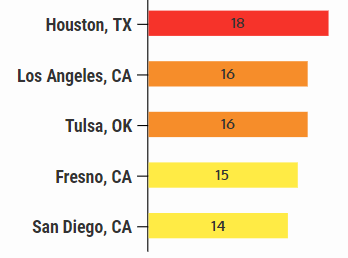
Q1 2019 Robberies by City
Houston Top City 3 out of Last 4 Years
|
Q1 2019 Cities
1. Houston, TX (18)
2. Tulsa, OK (16)
3. Los Angeles, CA
(16)
4. Fresno, CA (15)
5. San Diego, CA (14)
Q1 2018 Cities
1. Tulsa, OK (34)
2.
Houston, TX
(19)
3. San Antonio, TX & Las Vegas, NV (15)
4. Portland, OR (13)
5. Charlotte, NC & Madison, WI (11)
Q1 2017
Cities
1. Houston, TX
(23)
2. Shreveport, LA (19)
3. Tulsa, OK (17)
4. Colorado Springs, CO (15)
5. Oklahoma City, OK (12)
Q1 2016 Cities
1. Houston, TX (23)
2. Memphis, TN (20)
3. Tulsa, OK (14)
4. Dayton, OH
5. Indianapolis, IN |
 |
|
|
