
The D&D Daily's
Publicly Reported
Robbery Report
Mid-Year & Q2 2018
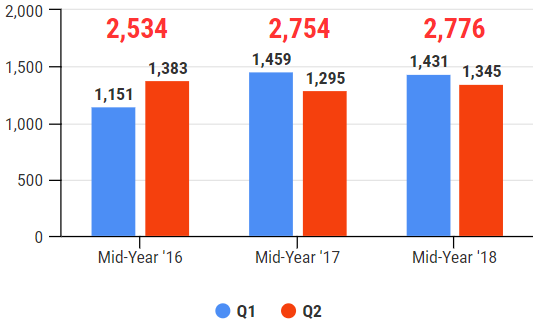
Robberies Up 9.5% Since 2016
Most Mid-Year Robberies Ever Reported by the Daily


|
Mid-Year & Quarterly Comparison 2016-2018 |
||
 |
||
|
|
Q1 & Q2 - 2017 vs. 2018 • Q1 robberies (1,431) down 1.9% • Q2 robberies (1,345) up 3.9% |
|
|
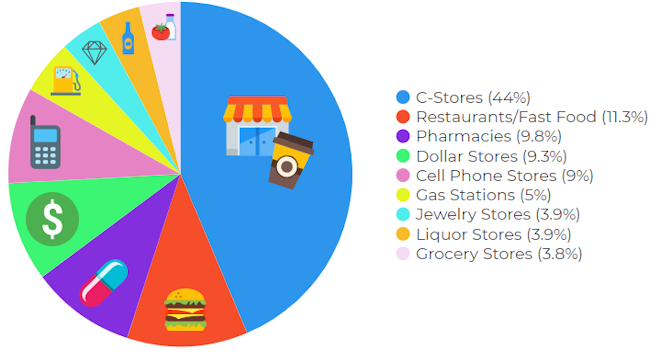
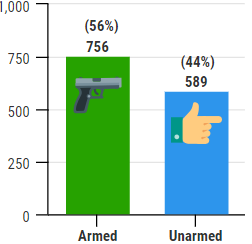
C-Stores remain top store type
|
||||||||||||

|
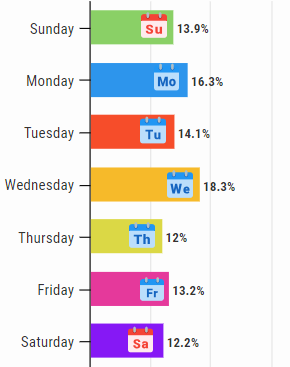
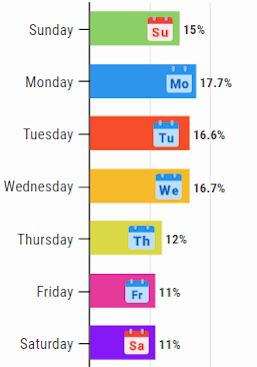
Mid-Year & Q2 Robberies by Weekday
*Not all incidents reported a weekday
•
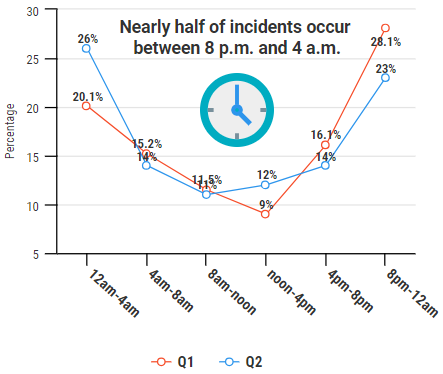
66% of Robberies Occur Sunday through Wednesday
In Q1, 48% of incidents fell
between 8 p.m. and 4 a.m. - nearly identical to this quarter's reported robbery
times, as the graph above shows.
|
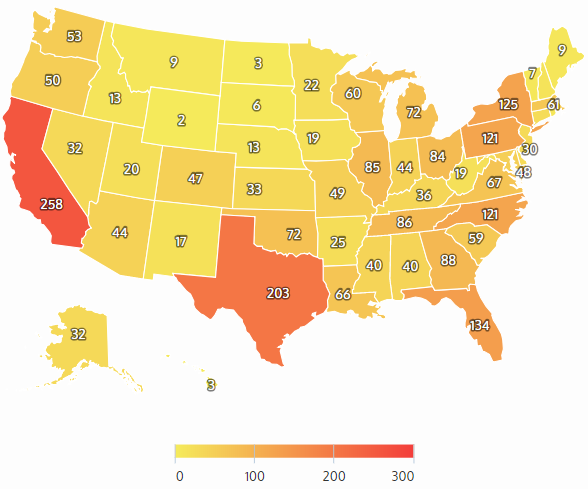
Mid-Year
Robberies by State
|
Mid-Year 2016 1. Texas (199) 2. California (162) 3. Florida (144) 4. Ohio* 5. Pennsylvania* |
Mid-Year 2017 1. California (231) 2. Texas (187) 3. Ohio (161) 4. Florida (160) 5. Pennsylvania (146) |
Mid-Year 2018 1. California (258) 2. Texas (203) 3. Florida (134) 4. New York (125) 5. PA & NC (121) |
Combined Top States 1. California (651) 2. Texas (589) 3. Florida (438) 4. Pennsylvania* 5. Ohio* |
|
*Began logging complete Top 5 data in 2017 |
|||
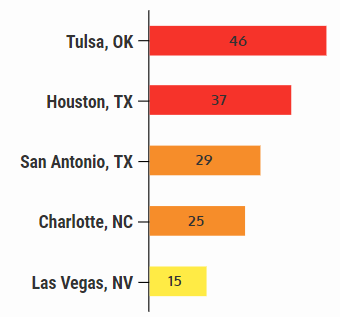
Mid-Year & Q2 Robberies by City
|
Mid-Year 2018 |
 |
|
2017 Full Year Highest |
2016 Full Year Highest |
![]() Share on Facebook
Share on Facebook
![]() Share on Twitter
Share on Twitter
![]() Share on LinkedIn
Share on LinkedIn
|
|
Methodology: The Daily collects this retail store specific information
from public news media sources throughout the United States and reports it daily
in our Retail Crime column. We do not survey any retailers or third parties nor
collect information from any retail executive. All of this information is
available through public news media outlets. We do not claim nor does it
represent all such incidents or deaths that may occur in retail locations or
retail corporate facilities as many may not be reported in the news media
depending on a number of variables outside of our control. We are not
responsible for the accuracy of the information reported in the various news
media outlets. We do not name any retailer, retail executive, suspect, or
victim.
Copyright: We reserve the rights to this industry exclusive
report and do not authorize its republication or reproduction without written
consent which may include a fee. By re-publishing or reproducing this report or
any parts of it without authorization the party agrees to pay a fee determined
by the D&D Daily.
Scarsdale Security
Sponsor of the D&D Daily’s Robbery Column
Thanks, Scarsdale, for making this column and this report possible.
Hey LP and AP Execs - Thank Scarsdale Security!
