|
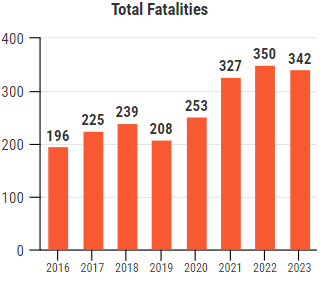
342 Fatalities
in 1st Half of 2023 - Down 2% From 2022
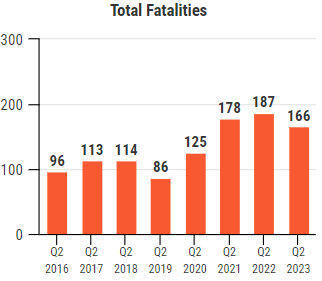
166 Q2 2023 Fatalities - Down 11% From Q2 2022
Associate Fatalities
Down 29%, Suspect Fatalities Up 36%
C-Stores Most Targeted Store, Houston Top Targeted City
Mid-Year Comparison | 2016-2023
|
Up 74% Overall
 |
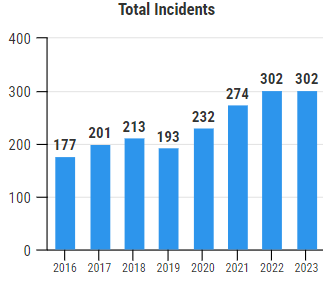
Up 71% Overall
 |
|
•
Fatalities Up 74% since 2016
•
Incidents Up 71% since 2016
•
Fatalities Down 2% From Mid-Year 2022
|
2nd Quarter Comparison
| 2016-2023
|
Up 73% Overall
|
Up 56% Overall

|
|
•
166 Fatalities – Up 73% since 2016
•
142 Incidents – Up 56% since 2016
•
Fatalities Down 11% From Q2 2022
|
Mid-Year
2023's 342
Retail Violent Fatalities by Category
82% Victims - 18% Suspects
59% Customers - 19.5% Associates - 3.5% LP/LE/Security
18% Suspects
|

|
342 Total Mid-Year 2023 Violent Deaths
•
18%,
61 Suspects -
up 36% from '22
•
59%,
202 Customers - up 6% from '22
•
19.5%, 67 Associates - down 29% from '22
•
3.5%, 12 LE/LP/Security - down 37% from '22
350 Total Mid-Year 2022 Violent Deaths
•
13%, 45 Suspects
•
55%,
191 Customers
•
27%, 95 Associates
•
5%, 19 LE/LP/Security
327 Total Mid-Year 2021 Violent Deaths
• 28%,
59 Suspects
•
40%, 168
Customers
•
26%, 91 Associates
•
6%, 9 LE/LP/Security
253 Total Mid-Year 2020 Violent Deaths
• 28%,
72 Suspects
•
40%, 101
Customers
•
26%, 66 Associates
•
6%, 14 LE/LP/Security
|
208 Total Mid-Year
2019 Violent Deaths
•
31%, 65 Suspects
• 49%,
103 Customers
•
16%, 34 Associates
•
3%, 6 LE/LP/Security
239
Total
Mid-Year
2018 Violent Deaths
• 29%,
69 Suspects
•
49%,
116 Customers
•
20%, 48 Associates
•
2%, 6 LE/LP/Security
225
Total Mid-Year
2017 Violent
Deaths
•
38%, 86 Suspects
•
40%, 90 Customers
•
18%, 40 Associates
•
4%, 9 LE/LP/Security
|
|
|
Mid-Year 2023 Fatalities
Location
57% In-Store,
39% Parking Lots,
4% Off Premises
|

|
|
|
Mid-Year
2023
Totals
•
57%, 195 inside store or mall
•
39%,
134 killed in parking lots
•
4%, 13 died off premises
Mid-Year
2022
Totals
•
45%, 158 inside store or mall
•
53%,
184 killed in parking lots
•
2%, 8 died off premises
Mid-Year
2021
Totals
•
53%, 173 inside store or mall
•
42%,
138 killed in parking lots
•
5%, 16 died off premises
Mid-Year
2020
Totals
•
55%, 139 inside store or mall
•
39%, 99 killed in parking lots
•
6%, 15 died off premises
|
Mid-Year 2019
Totals
•
46%, 96 killed in parking lots
•
38%, 79 inside store or mall
•
16%, 33 died off premises
Mid-Year
2018 Totals
•
53%, 126 killed in parking lots
•
33%, 79 inside store or mall
•
14%, 34 died off premises
Mid-Year
2017 Totals
•
53%,
119
killed in parking lots
•
35%, 78 inside store or mall
•
12%, 28 died off premises
|
|
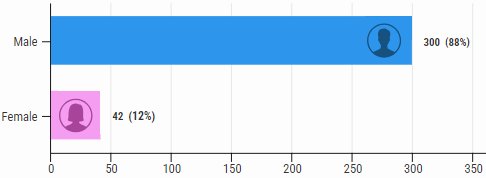
Mid-Year 2023 Total Fatalities by Gender
88% Male - 12% Female
|
|
|
Mid-Year
2023 Totals
•
88%, 300 Males
•
12%, 42 Females
Mid-Year
2022 Totals
•
86%, 301 Males
•
14%, 49 Females
Mid-Year
2021 Totals
•
84%, 274 Males
•
16%, 53 Females
Mid-Year
2020 Totals
•
86%, 217 Males
•
14%, 36 Females
|
Mid-Year 2019 Totals
•
82%, 172 Males
•
12%, 25 Females
•
5%, 11 n/a
Mid-Year 2018 Totals
•
78%, 188 Males
•
16%, 38 Females
•
5%, 13 n/a
Mid-Year 2017 Totals
•
88%, 198 Males
•
12%, 27 Females
|
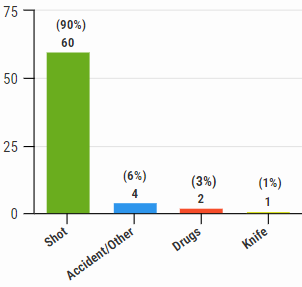
Mid-Year 2023: 67 Associate Fatalities By Gender & Method
|
|

|
 |
|
|
Mid-Year 2023 Totals
•
87%, 58 Males
•
13%, 9 Females
Mid-Year 2022 Totals
•
79%, 75 Males
•
21%, 20 Females
Mid-Year 2021 Totals
•
79%, 72 Males
•
21%, 19 Females
Mid-Year 2020 Totals
•
89%, 59 Males
•
11%, 7 Females
Mid-Year 2019 Totals
•
76%, 26 Males
•
21%, 7 Females
•
3%, 1 n/a
Mid-Year
2018 Totals
•
69%, 33 Males
•
27%, 13 Females
•
4%, 2 n/a
Mid-Year
2017 Totals
•
75%, 30 Males
•
25%, 10 Females
|
Mid-Year 2023 Totals
•
90%, 60 Killed by gun
•
6%, 4
Other/Accident
•
3%, 2 Drugs
•
1%, 1 Knife
Mid-Year 2022 Totals
•
93%, 88 Killed by gun
•
3%, 3 car crash
•
3%, 3 stabbed/beaten
•
1%, 1 fire
Mid-Year 2021 Totals
•
93.5%, 85 Killed by gun
•
3.5%, 3
stabbed
•
1%, 1
car crash
•
1%, 1 accident
•
1%, 1 drugs
Mid-Year 2020 Totals
•
89%, 59 Killed by gun
•
8%, 5
stabbed/beaten
•
3%, 2
car crash
Mid-Year 2019 Totals
•
94%, 32 Killed by gun
•
3%, 1
stabbed/beaten
•
3%, 1
car crash
Mid-Year 2018 Totals
•
81%, 39 Killed by gun
•
15%, 7
stabbed/beaten
•
2%,
1 run over
•
2%,
1 n/a
Mid-Year 2017 Totals
•
80%, 32 Killed by gun
•
15%, 6
stabbed/beaten
•
2%, 1 fire
•
2%, 1 suicide
|
Mid-Year 2023
Fatality Incidents by Store Type
C-Stores Top Store Type 8 Straight Years

|
Mid-Year 2023:
1.
C-Stores (35%)
2. Restaurants (14%)
3. Mall (10%)
4. Grocery (8%)
5. Specialty (7%)
|
Mid-Year 2022:
1.
C-Stores (28%)
2. Restaurants (23%)
3. Grocery (8%)
4. Gas Station (8%)
5. Mall (6%)
|
Mid-Year 2021:
1.
C-Stores (38%)
2. Restaurants (16%)
3. Grocery (9%)
4. Gas Station (6%)
5. Liquor/Tobacco (5%)
|
Mid-Year 2020:
1.
C-Stores (33%)
2. Restaurants (15%)
3. Grocery (7.5%)
4. Big Box (7%)
5. Liquor/Tobacco (6%)
|
Mid-Year 2019:
1.
C-Stores (20%)
2. Restaurants (11.5%)
3. Gas Stations (11%)
4. Malls (8.8%)
5. Specialty (8.5%)
|
Mid-Year
2018:
1.
C-Stores (19%)
2. Gas Stations (13.4%)
3. Restaurants (12.4%)
4. Malls (10.8%)
5. Other (9.3%)
|
Mid-Year
2017:
1.
C-Stores (28.5%)
2. Big Box (13%)
3. Restaurants (12.5%)
4. Malls (9%)
5. Other (8%)
|
2016:
1.
C-Stores (26%)
2. Gas Stations (25%)
3. Big Box (21%)
4. Restaurants (9%)
5. Dollar Stores (8%)
|
&uuid=(email))
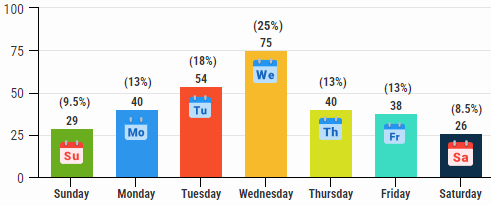
Mid-Year 2023 Fatality Incidents by Weekday
Wednesday
Moves to Highest - Saturday Falls to Lowest
|
Mid-Year 2023:
1. Wednesday - 75
2. Tuesday - 54
3. Thursday - 40
3. Monday - 40
5. Friday - 38
6. Sunday - 29
6. Saturday - 26
|
Mid-Year 2022:
1. Sunday - 65
2. Monday - 45
3. Tuesday - 43
4. Friday - 39
4. Saturday - 39
6. Thursday - 38
7. Wednesday - 33
|
Mid-Year 2021:
1. Saturday - 46
2. Monday - 45
3. Tuesday - 43
4. Wednesday - 38
5. Thursday - 36
5. Sunday - 36
7. Friday - 31
|
Mid-Year 2020:
1. Wednesday - 45
2. Tuesday - 42
3. Saturday - 34
4. Monday - 33
5. Sunday - 28
6. Thursday - 25
6. Friday - 25
|
|
Mid-Year 2019:
1. Tuesday - 43
2. Wednesday - 33
3. Thursday - 32
4. Saturday - 32
5. Sunday - 26
6. Monday - 23
7. Friday - 19 |
Mid-Year 2018:
1. Wednesday - 46
2. Tuesday - 40
3. Sunday - 38
4. Monday - 35
5. Saturday - 33
6. Thursday - 28
7. Friday - 19 |
Mid-Year 2017:
1. Monday - 40
2. Sunday - 37
3. Saturday - 30
4. Wednesday - 27
5. Tuesday - 27
6. Thursday - 27
7. Friday 18 |
2016:
1. Sunday
2. Friday
3. Saturday
4. Wednesday
5. Monday
6. Tuesday
7. Thursday |
|
*Complete data not available
for 2016
|
Mid-Year 2023 Fatality Incidents by State
Texas, California Top
States Past 8 Years

|
Mid-Year 2023:
1. Texas (42)
2. California (29)
3. Georgia (20)
4. Florida (15)
5. Louisiana (14)
|
Mid-Year 2022:
1. Texas (37)
2. California (27)
3. Georgia (23)
4. Pennsylvania (21)
5. Florida (18)
|
Mid-Year 2021:
1. Texas (28)
2.
California (17)
3.
Florida (16)
4. Georgia (15)
5. Ohio (14)
|
Mid-Year 2020:
1. California (34)
2. Texas (22)
3. North Carolina (15)
4. Missouri (13)
5. FL, GA, PA (12)
|
|
Mid-Year 2019:
1. California (27)
2. Texas (22)
3. Florida (13)
4. GA, VA & NC (10)
5. Tennessee & Illinois (8)
|
Mid-Year 2018:
1. Texas (29)
2. California (26)
3. Florida (14)
4. Georgia (12)
5. Alabama (11)
|
Mid-Year 2017:
1.
California (28)
2. Texas (23)
3. Georgia (18)
4. Florida (17)
5. Tennessee (12)
|
2016:
1. Texas (43)
2. California (39)
3. Florida (31)
4. Georgia (23)
5. Ohio (17)
|
Mid-Year 2023 Fatality Incidents by City
Houston
Most Deaths 6 out of 8 Years
| |
Mid-Year 2023:
1. Houston: 10
2. Columbus: 8
3. NYC / Philadelphia: 6
4. LA / Atlanta / Dallas / San Antonio: 5
5. Phoenix / Detroit / San Fran / Fort Worth: 3
Mid-Year 2022:
1. Houston: 15
2. Philadelphia: 10
3. Memphis: 8
4. Chicago: 6
5. Los Angeles / NYC: 3
Mid-Year 2021:
1. Chicago / Memphis / Las Vegas: 6
2. Houston / Portland, OR / Phoenix / Little Rock: 5
3. New Orleans / Philadelphia / Nashville: 4
Mid-Year 2020:
1. Houston, TX: 8
2.
Philadelphia, PA: 7
3. Chicago, IL/Cleveland, OH: 5
4. Los Angeles/Phoenix/Kansas City, MO: 4
5. Tulsa, OK/Milwaukee, WI/Macon, GA: 3
Mid-Year 2019:
1. Houston, TX
2.
Charlotte, NC
3. Los Angeles, CA
3. St. Louis, MO
3. Tulsa, OK/Chicago, IL
Mid-Year 2018:
1. Houston, TX
2. Nashville, TN
3. Birmingham, AL
4. Melcroft, NC
5. Indianapolis IN/Kansas City, MO
Mid-Year 2017:
1. Memphis, TN
2. Houston, TX
3. Atlanta, GA
4. St Louis, MO
5. Las Vegas, NV/Chicago, IL
2016:
1. Houston, TX
2. Atlanta, GA
3. Detroit, MI
4. Phoenix, AZ
5. Chicago, IL
|

|
Methodology: The Daily collects this retail store specific information
from public news media sources throughout the United States and reports it daily
in our Retail Crime column. We do not survey any retailers or third parties nor
collect information from any retail executive. All of this information is
available through public news media outlets. We do not claim nor does it
represent all such incidents or deaths that may occur in retail locations or
retail corporate facilities as many may not be reported in the news media
depending on a number of variables outside of our control. We are not
responsible for the accuracy of the information reported in the various news
media outlets. We do not name any retailer, retail executive, suspect, or
victim.
Copyright: We reserve the rights to this industry exclusive
report and do not authorize its republication or reproduction without written
consent which may include a fee. By re-publishing or reproducing this report or
any parts of it without authorization the party agrees to pay a fee determined
by the D&D Daily.
 Share on Facebook
 Share on Twitter
 Share on LinkedIn
|
Click here to read all
of the Daily's exclusive retail crime reports
|
|
