
The D&D Daily's
Publicly Reported
'Retail Violent Death Report'
Q2 & Half Year 2017
Deaths Up 13% Q2 - Up 15% in Half
Year
113 Deaths Q2 - 225 Deaths Half Year
With a 15% increase in violent deaths over the first half of 2016, the most
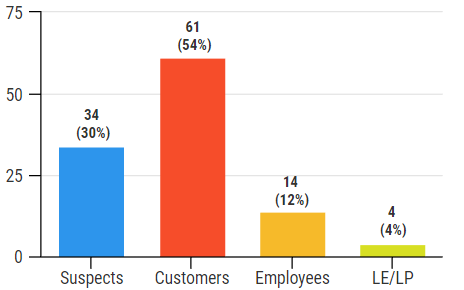
alarming numbers are the sharp 32% increase in victims' deaths and 35% decrease
in suspects' deaths in the second quarter of this year, with 61 customers, 14
employees, and 4 law enforcement and LP associates' deaths.
The three trends that continue unchanged are the day of the week, with Saturday,
Sunday and Monday being the most violent and deadly days in retail, and males
being predominately shot and killed, being the most prevalent.
Interesting as well is the top five states, which almost line up with ORC
activity, with California, Florida, Texas, and Georgia leading the way and
Tennessee and Arkansas following closely behind.
It's probably the most difficult piece to report on here at the Daily, as we
continue to refine and develop our reporting methods.
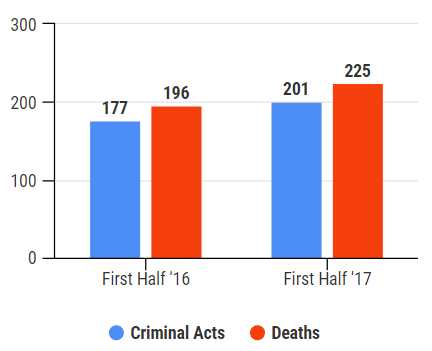 |
Half Year Comparison First Half of 2017 • 225 total retail violent deaths • 201 total criminal acts Compared to 2016 • Deaths up 15% • Criminal acts up 14% |
|
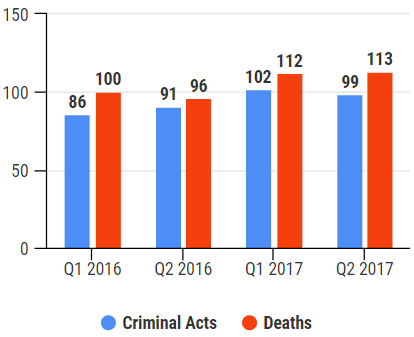 |
Quarterly Comparison Q2 2017 • 113 Retail violent deaths • 99 Criminal acts Compared to Q2 2016 • Deaths up 18% • Criminal acts up 9% |
|
Q2 Violent Deaths - 79 Victims/34 Suspects |
|
|
Victim Deaths Up 32% Over Q1 • 70%, 79 victims killed - up 32% • 30%, 34 suspects killed - down 35% Q1 2017 • 53.5%, 60 victims killed • 46.5%, 52 suspects killed 2016 Annual Study • 56%, (211) suspects killed • 43%, (163) victims |
 |
|
Q2: 34 Retail Crime Deaths - 79 Homicides |
|
|
Q1 2017 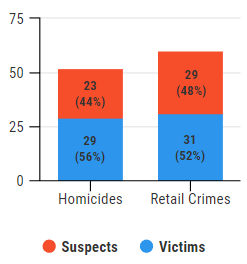 |
53.5%, 60
Retail Crime Deaths Robberies, burglaries & shoplifting • 52%, 31 Victims • 48%, 29 Suspects 46.5%, 52 Homicides Drug deals, arguments, murder/suicides • 56%, 29 Victims • 44%, 23 Suspects |
Q2 2017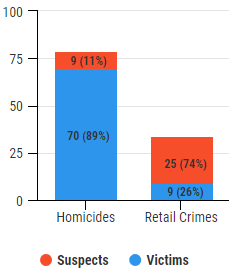 |
30%, 34
Retail Crime Deaths Robberies, burglaries & shoplifting • 26%, 9 Victims • 74%, 25 Suspects 70%, 79 Homicides Drug deals, arguments, suicides, police shooting • 89%, 70 Victims • 11%, 9 Suspects |
|
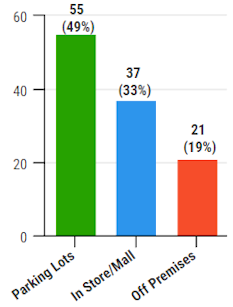
55 Parking Lot Deaths - 37 In-Store Violent Deaths |
||
|
•
49%, 55 killed in parking lots • 33%, 37 inside store or mall • 19%, 21 died off premises (fleeing, police chase) |
 |
|
|
37 In-Store Violent Deaths 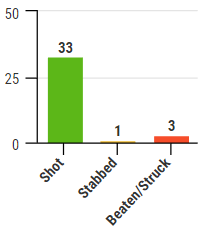 |
79 Victims Violently Killed 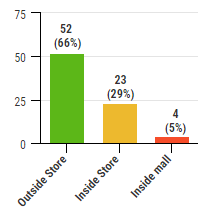 |
|
•
33 were shot • 1 was stabbed • 3 victims from misc. causes |
70% of total deaths • 66%, 52 killed outside the store • 29%, 23 killed inside the store • 5%, 4 killed inside mall |
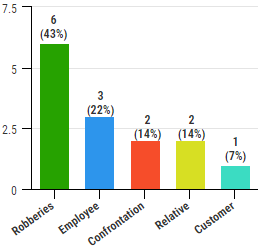
14
Employees Violently Killed5 in Workplace Violence Deaths
|
• 43%, 6 killed during robberies, burglaries or thefts • 3 killed by current employee • 2 killed by relative |
 |
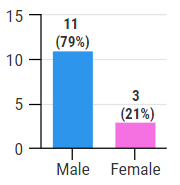 |
• 79%, 11 Males • 21%, 3 Females |
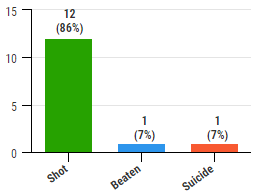 |
• 86% Killed by gun • 1 beaten • 1 committed suicide |
Total Deaths by Gender
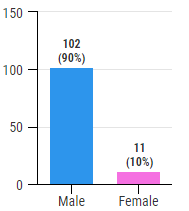 |
• 90%, 102 Males • 10%, 11 Females |
Total Deaths by Store Type
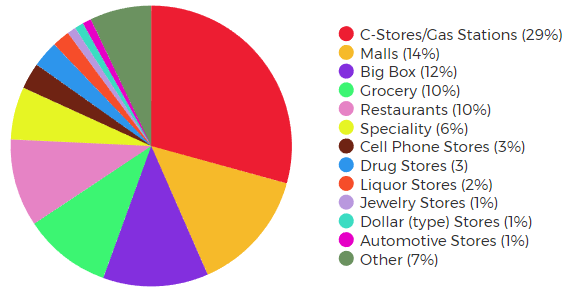 *Other category consists of motels, barber shops, and banks |
Violent Deaths by Weekday
52% occur on Sat,
Sun, Mon in Q2
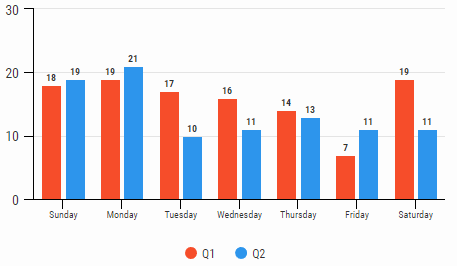
*3 days not disclosed
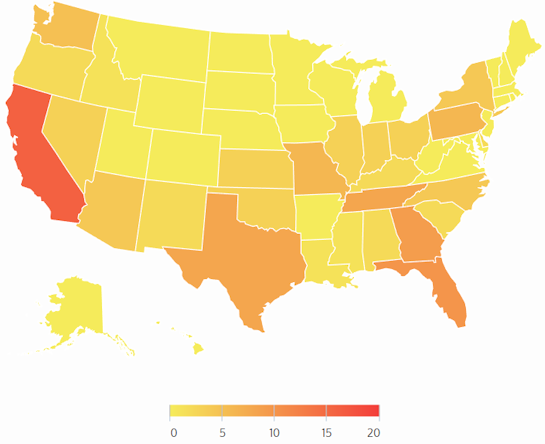
Violent Deaths By State
|
Q2 Highest retail deaths: 1. California (16) 2. Florida (10) 3. Georgia (9) 4. Texas (8) 5. Tennessee (8) |
Q1 Highest retail deaths: 1. Texas (15) 2. California (12) 3. Georgia (9) 4. Florida & North Carolina (7) 5. Arkansas and Tennessee (5) |
|
Violent Deaths by City
|
Q2
Highest retail deaths: 1. Memphis, TN (5) 2. St. Louis, MO (3) 3. Las Vegas, NV (3) 4. Chicago, IL (2) 5. Atlanta, GA (2) Q1 Highest retail deaths: 1. Houston, TX (5) 2. Memphis, TN (4) 3. Little Rock, AR (3) 4. Indianapolis, IN (3) 5. Atlanta, GA (3) |
Q2 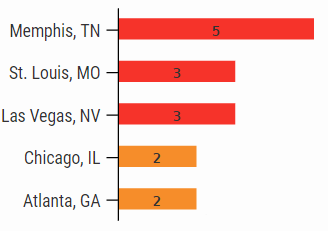 |
![]() Share on Facebook
Share on Facebook
![]() Share on Twitter
Share on Twitter
![]() Share on LinkedIn
Share on LinkedIn
|
|
Methodology: The Daily collects this retail store specific information
from public news media sources throughout the United States and reports it daily
in our Retail Crime column. We do not survey any retailers or third parties nor
collect information from any retail executive. All of this information is
available through public news media outlets. We do not claim nor does it
represent all such incidents or deaths that may occur in retail locations or
retail corporate facilities as many may not be reported in the news media
depending on a number of variables outside of our control. We are not
responsible for the acccuracy of the information reported in the various news
media outlets. We do not name any retailer, retail executive, suspect, or
victim.
Copyright: We reserve the rights to this industry exclusive
report and do not authorize its republication or reproduction without written
consent which may include a fee. By re-publishing or reproducing this report or
any parts of it without authorization the party agrees to pay a fee determined
by the D&D Daily.