

The D&D Daily's Publicly Reported
2018 Q1 ORC Report
Q1 Cases Up 8.2%
2015 Dramatic 55% Increase Remains Steady
ORC Dollar Amount Remains Flat to LY
Five-Year Quarterly Comparison
2014 thru 2018
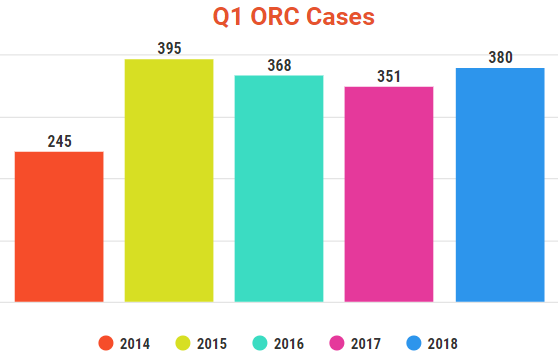
With 380 publically reported cases in Q1 ’18 we saw an 8.2% increase over Q1
2017.
2013 was excluded from our comparisons – as it was the first year
developing the research model.
2015’s 61% increase over 2014 may be debatable by some. But we feel very
confident in the numbers and our research model.
It also corresponds to the dramatic increase in data breaches, cyber crime,
credit card & gift card fraud spikes, and the upcoming move to EMV.
Therefore we included it in our comparison calculations. Especially given that
the last four years ORC publicly reported cases have remained somewhat level
which lends creditability to our model and the report itself.
Not to mention the direct link to the opioid epidemic which first started
appearing in the headlines around late 2015 early 2016, which could be viewed as
another confirmed contributor to the 55% increase in ORC in 2015 and has now
grown to such a problem that the vast majority of ORC articles mention
addiction as the primary driver.
The fact is that publically reported ORC cases have remained level even with
shrinking media outlets and fewer reporters covering individual cities.
This dramatic increase in 2015 and the continued steady levels of activity in
our opinion is directly attributed to the growth of the ORC Associations across
the America and the great work they do in resolving ORC cases and is obviously
supported by all of the new ORC laws sweeping the nation and the increased
awareness.
Even with all of these efforts, ORC remains a significant gateway criminal
problem and if our research is correct we saw a dramatic 55% increase in 2015
that has remained level. Meaning that, we as an industry are apprehending
more but we haven’t been able to turn the tide even with all of the efforts
and EMV.
Cyber crime, the internet, and the opioid epidemic have become so engrained in
society that ORC is a never ending plague that we all must remain vigilant and
continue to fight this problem impacting our stores, our associates, and our
customers. As it is this group that negatively impacts store safeness and cost
lives in the stores. Let’s keep them all safe out there.
ORC Cases by Average Dollar Amount
Below is a breakdown of the total dollar amount reported in Q1 of each year
since 2013, as well as the average dollar amount per case.
We removed two credit card cases and one counterfeit case ($200M in 2014,
$325M in 2015 & $200M in 2016) which skewed the average case value.
Removed, the average dollar amount per case ranged from a low of $21,878 to a
high of $152,624, as the table below shows.
| Year | $ Amount Reported | Average $ Amount |
| 2013 | $24,555,110 | $136,417 |
| 2014 | $116,392,986 | $152,624 |
| 2015 | $380,464,168 | $140,415 |
| 2016 | $208,051,138 | $21,878 |
| 2017 | $32,912,889 | $93,768 |
| 2018 | $32,829,145 | $86,392 |
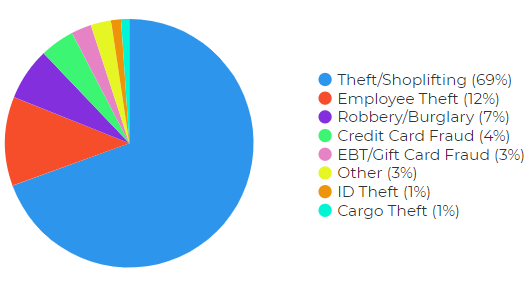
ORC Cases By Type
Of the 380 total publicly reported ORC cases in 2017, the most popular
method used was shoplifting/theft (264 incidents), which represented
69 percent of all cases. Employee theft and burglary/robbery (a
combined 19% with 70 incidents)
were also common in first quarter cases.
The
chart below shows these and other methods used in ORC cases reported
by the D&D Daily in Q1 2018.
 |
ORC Cases by Merchandise Stolen
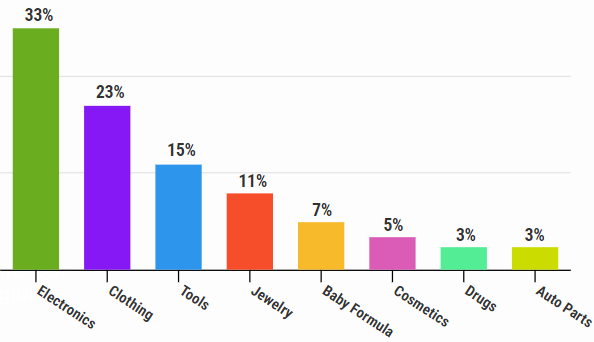
Of the most common types of merchandise targeted by ORC suspects in Q1 2018, electronics, clothing and tools highest, as the graph indicates. Jewelry, baby formula, cosmetics, drugs and auto parts are also commonly targeted items.
ORC Suspect Comparison
63% Male vs. 37% Female remains consistent over six years.
| Year | Q1 Suspects | Male | Female | Unreported | % Male | % Female |
| 2013 | 714 | 241 | 144 | 329 | 63% | 37% |
| 2014 | 649 | 408 | 241 | 0 | 63% | 37% |
| 2015 | 894 | 480 | 298 | 116 | 62% | 38% |
| 2016 | 762 | 423 | 250 | 89 | 63% | 37% |
| 2017 | 732 | 337 | 201 | 194 | 63% | 37% |
| 2018 | 826 | 463 | 280 | 83 | 62% | 38% |
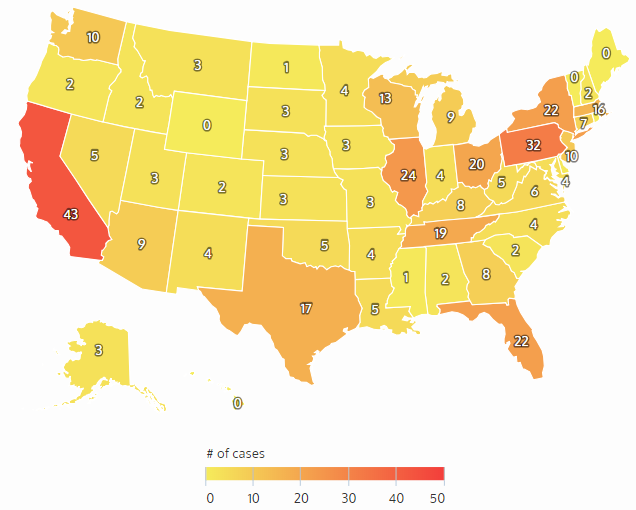
ORC Cases by State & City
California remains in Top Two six years straight. With
Florida and Pennsylvania ranking in the top four for six years as well.
|
Top States - Q1 2018 1. California (43) 2. Pennsylvania (32) 3. Illinois (24) 4. New York & Florida (22 each) 5. Ohio (20) |
Top Cities - Q1 2018 • Las Vegas, Nevada • Houston, Texas • Oklahoma City, Oklahoma • Albuquerque, New Mexico • Chicago, Illinois |
|
Top States in 2017 1. California (88) 2. Florida (82) 3. Pennsylvania (68) 4. Texas (59) 5. Illinois (54) |
Top Cities in 2017 1. Houston, TX & Milburn, NJ (9) 2. Memphis, TN & Columbus, OH (8) 3. Louisville, KY & Lexington, KY (7) 4. Polk County, FL, Oklahoma City, OK & NYC (6) |
| 2012 1. Florida (63) 2. California (60) 3. Texas (52) 4. Pennsylvania (45) 5. New York (38) |
2013 1. Florida (102) 2. Pennsylvania (81) 3. Texas (65) 4. California (61) 5. New York (41) |
2014 1. Florida (142) 2. Pennsylvania (89) 3. California (87) 4. New York (76) 5. Texas (74) |
2015 1. Florida (116) 2. Pennsylvania (76) 3. Texas (75) 4. California (73) 5. New York (65) |
2016 1. Florida (116) 2. California (112) 3. Pennsylvania (111) 4. Texas (96) 5. New York (88) |
![]() Share on Facebook
Share on Facebook
![]() Share on Twitter
Share on Twitter
![]() Share on LinkedIn
Share on LinkedIn
|
|
Methodology: The Daily
collects this retail store specific information from public news media
sources throughout the United States and reports it daily in our Organized
Retail Crime column. We do not survey any retailers or third parties nor collect
information from any retail executive. All of this information is available
through public news media outlets. We do not claim nor does it represent all
such incidents or deaths that may occur in retail locations or retail
corporate facilities as many may not be reported in the news media depending
on a number of variables outside of our control. We are not responsible for
the acccuracy of the information reported in the various news media outlets.
We do not name any retailer, retail executive, suspect, or victim.
Copyright: We reserve the rights to this industry exclusive
report and do not authorize its republication or reproduction without
written consent which may include a fee. By re-publishing or reproducing
this report or any parts of it without authorization the party agrees to pay
a fee determined by the D&D Daily.
Sponsored by
